Intelligent Gameplay
Connect Four
This was a collaboration with Bella, whose github account can be found here: github
The basis of the game is that a single Connect Four board can be set up with a particular width and height, and then two algorithms can be chosen to play on it. The only thing that each algorithm does is accept the current state of the board as a parameter, then return its chosen column according to its own calculations. The board object contains a number of other pieces of information as well as the board itself, which can be used by the algorithm - for example, a list of moves that were played throughout the game. Another function then controls all of the gameplay, coordinating the moves and calling the algorithms when necessary.
All the algorithms included:
- random
- furthest possible left+right
- as close to/far away from the opponent's previous move as possible
- moving through the columns one by one
- choosing a random column and filling it, repeatedly
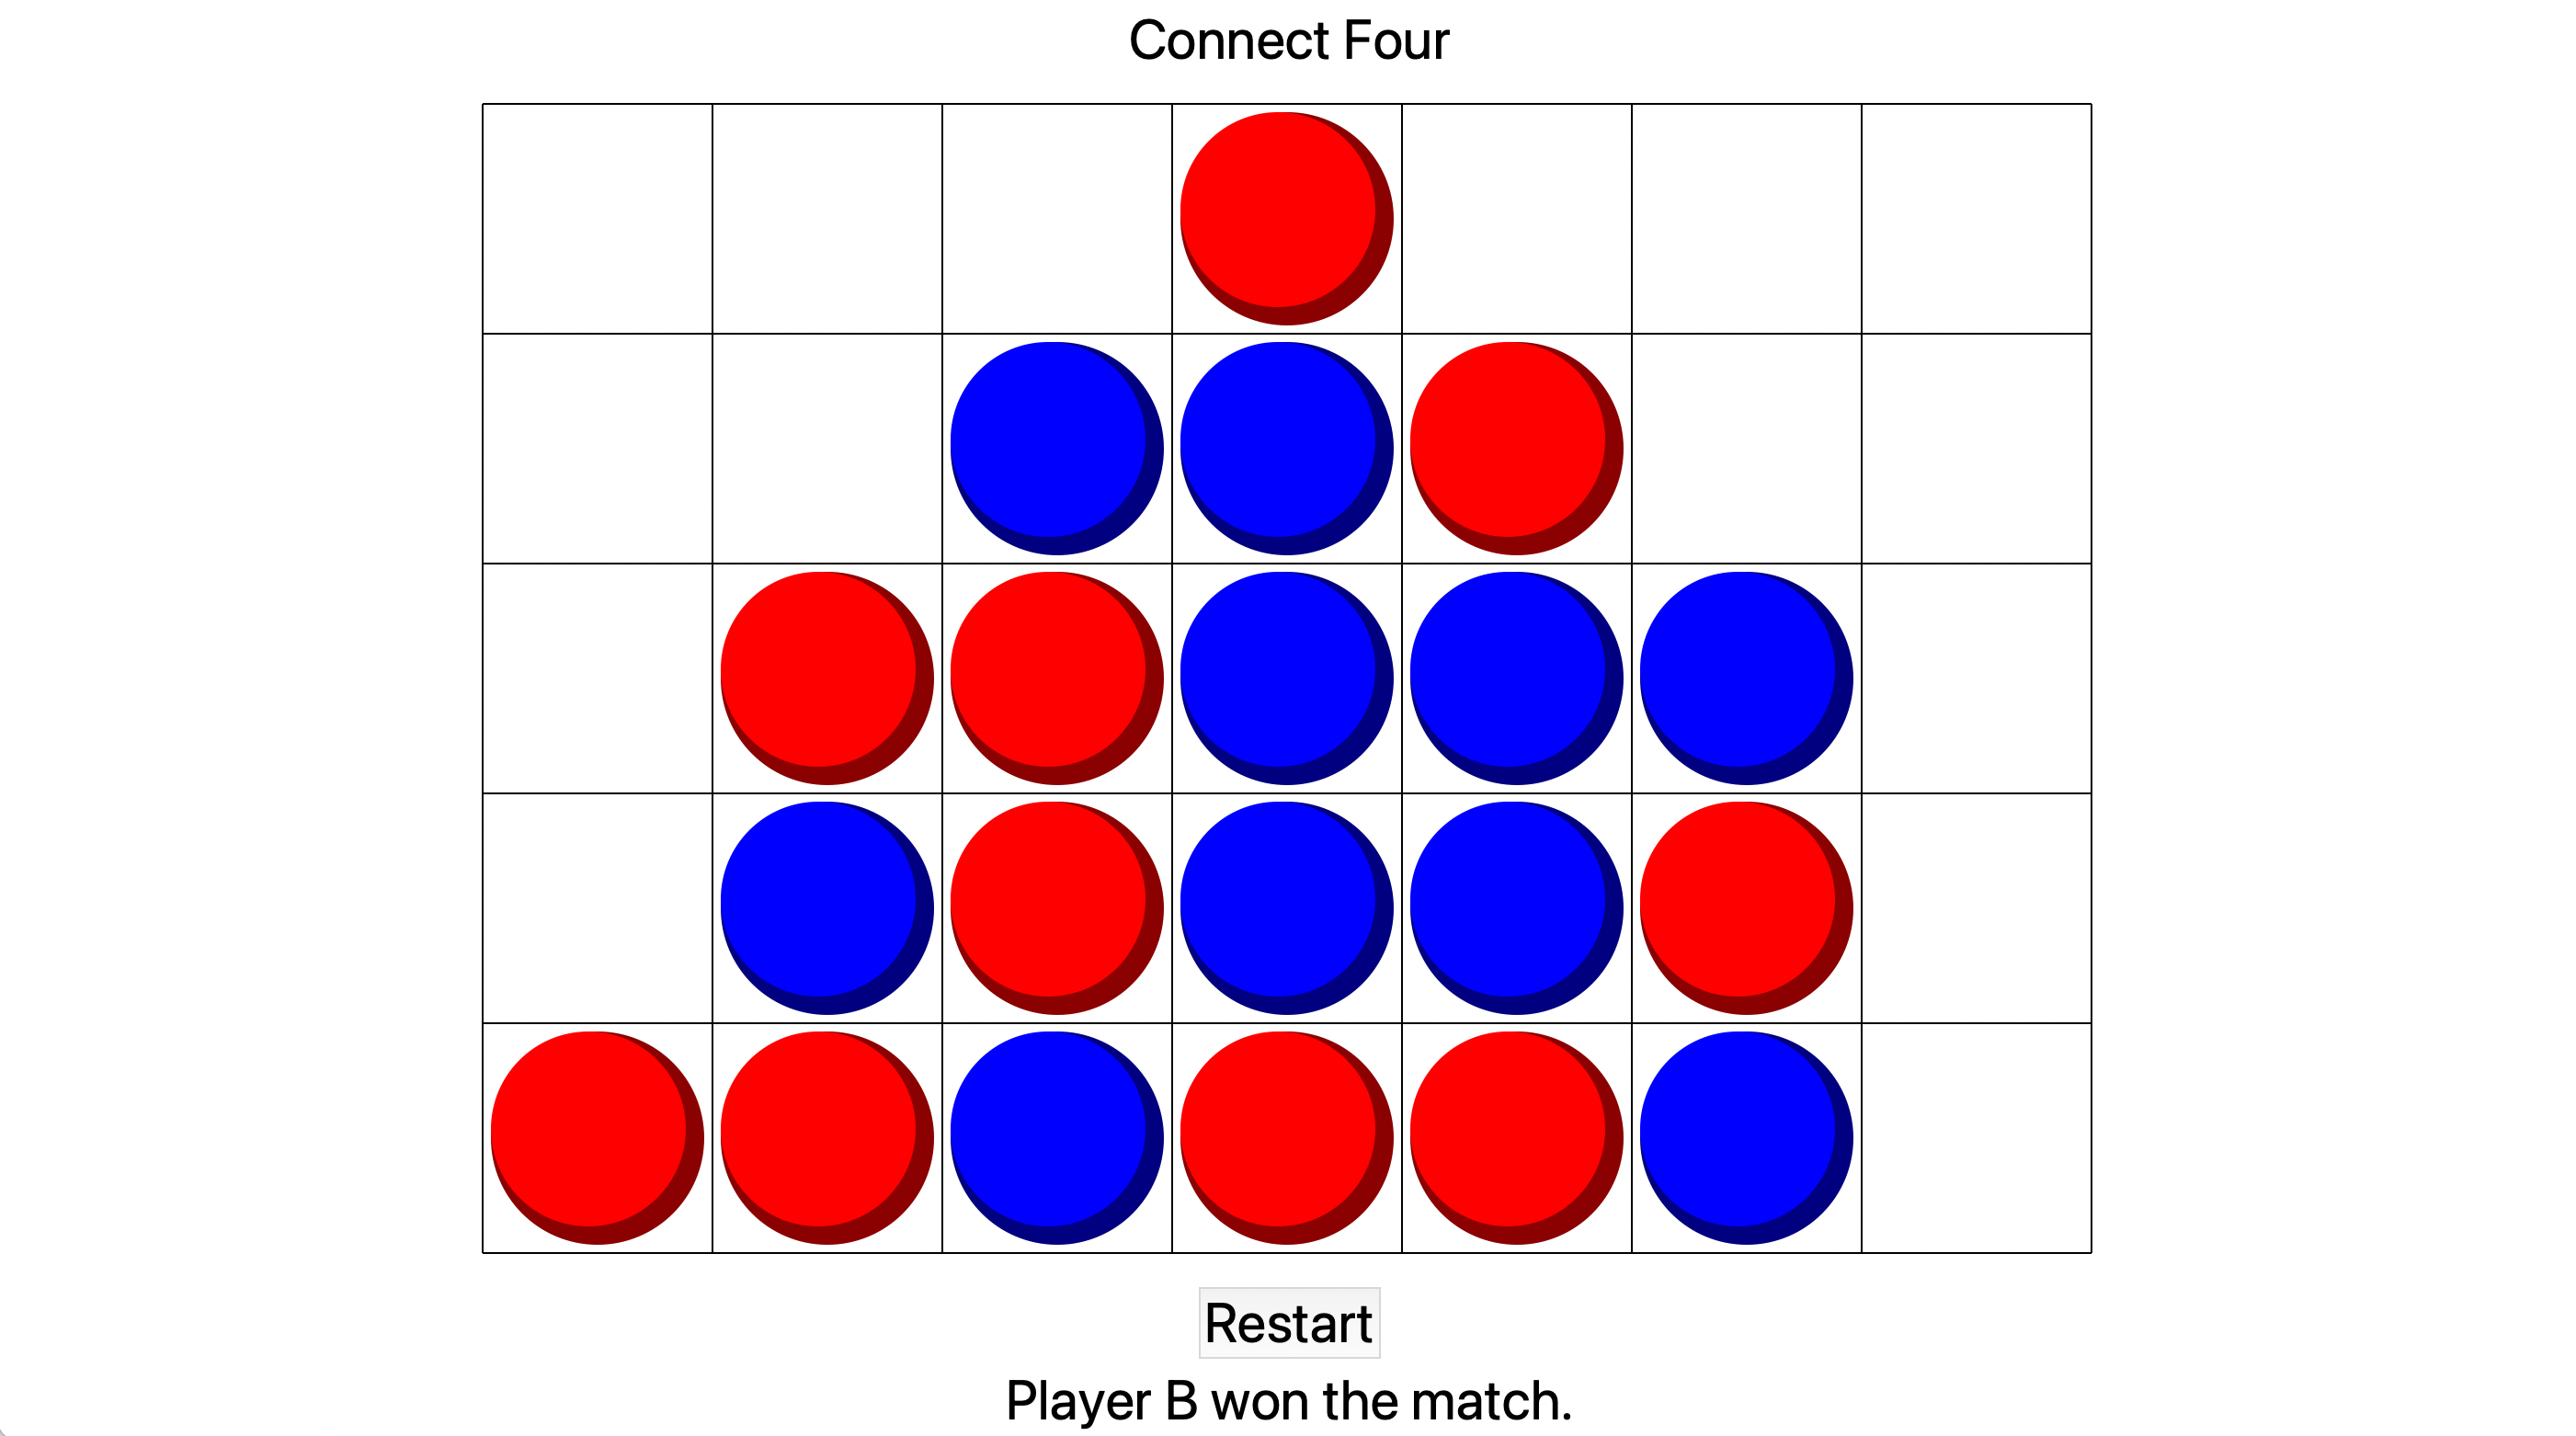
Finally, we wrote a smart algorithm, which makes its decision by taking the current board state and generating many other matches which continue on from the current position. These matches use the other algorithms, and many matches are generated for each possible combination. This produces a large amount of data, which the smart algorithm then analyses and produces a dictionary mapping each 'next move choice' to its corresponding number of wins, draws and losses. Then a decision is made according to these statistics.
It may seem that this is a very slow method, but the aim was to produce a program that can play intelligently without requiring the programmer to study the theory of Connect Four in any great depth, utilising the power of computing instead. Regardless, the program takes mere milliseconds to make its decision, even when running thousands of potential matches, and the end result is nearly impossible to win against. I have provided evidence of me playing poorly and losing.
Noughts and Crosses
A simpler, earlier version of the Connect Four algorithm, which generates games randomly instead of according to any other algorithm. In this program, the games are stored in a single string called a match code that represents every move in the game. Each of the squares in the board are represented by a single number, starting from the top-left corner (at 0) and moving rightwards then downwards, so square 4 represents the middle square. At the start and end, a letter is attached to indicate which player started and won, respectively. For example, a code of A06438A means:
- Player A started.
- Player A placed in square 0 (the top-left corner).
- Player B placed in square 6 (the bottom-left corner).
- Player A placed in square 4 (the middle square).
- Player B placed in square 3 (the middle-left corner).
- Player A placed in square 8 (the bottom-right corner).
- Player A won, having placed in a diagonal line.
In order to check if a player has won, the computer takes the match code and divides it into each of the player's squares - in this example, A would own squares 0, 4 and 8, and player B owns square 3 and 6. The computer then compares each of these squares to a list of 'winning combinations', which indicate a win if a player has all 3 of them (in any order). Player A had a winning combination, so they won.
This is an example of the data the computer produces when making its decision. These are the win rates for each of the possible starting moves in a game, produced by running 1000 random games:
{'0': 0.34545454545454546, '1': 0.22727272727272727, '2': 0.31007751937984496, '3': 0.1981981981981982, '4': 0.6629213483146067, '5': 0.14754098360655737, '6': 0.42990654205607476, '7': 0.1935483870967742, '8': 0.35658914728682173}
You can see that square 4, which corresponds to the middle square, has the highest win rate of 0.66. The corner squares, which are 0, 2, 6 and 8, all have similar win rates at around 0.3, and the middle-row squares have the lowest win rates. The differences in win rates for these groups are due to randomness.
Based on this data, the computer would choose square 4. In fact, the computer always starts with square 4.
Here is another example. This is one particular match, where the computer is crosses and the user is circles, and it is the computer's turn:
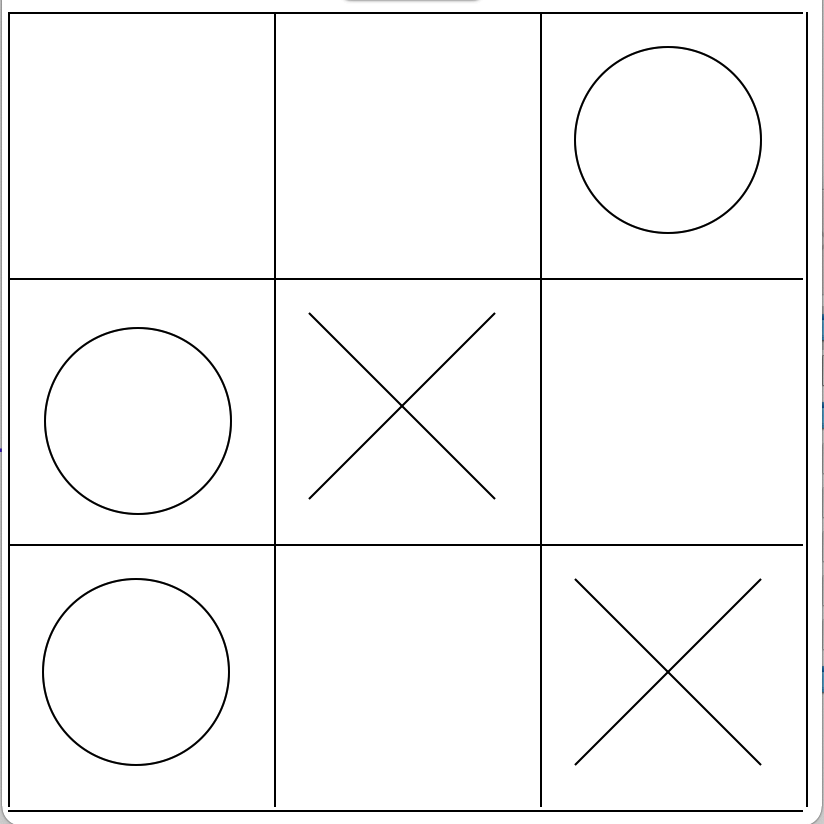
{0': 1.0, '1': -0.048327137546468404, '5': -0.36929460580912865, '7': -0.03125}
Square 0, the top-left corner, has a win rate of 1, meaning the computer wins every time it places here. All the other squares have negative win rates, so they lost most of the time when placing in these squares, presumably as this allows the circle player to place in the top-left corner. (Note that the circle player is simulated by random games, not an actual user. If it was an actual person, placing in any square except for the top-left square would presumably lead to the computer losing every time.)
3D transformations
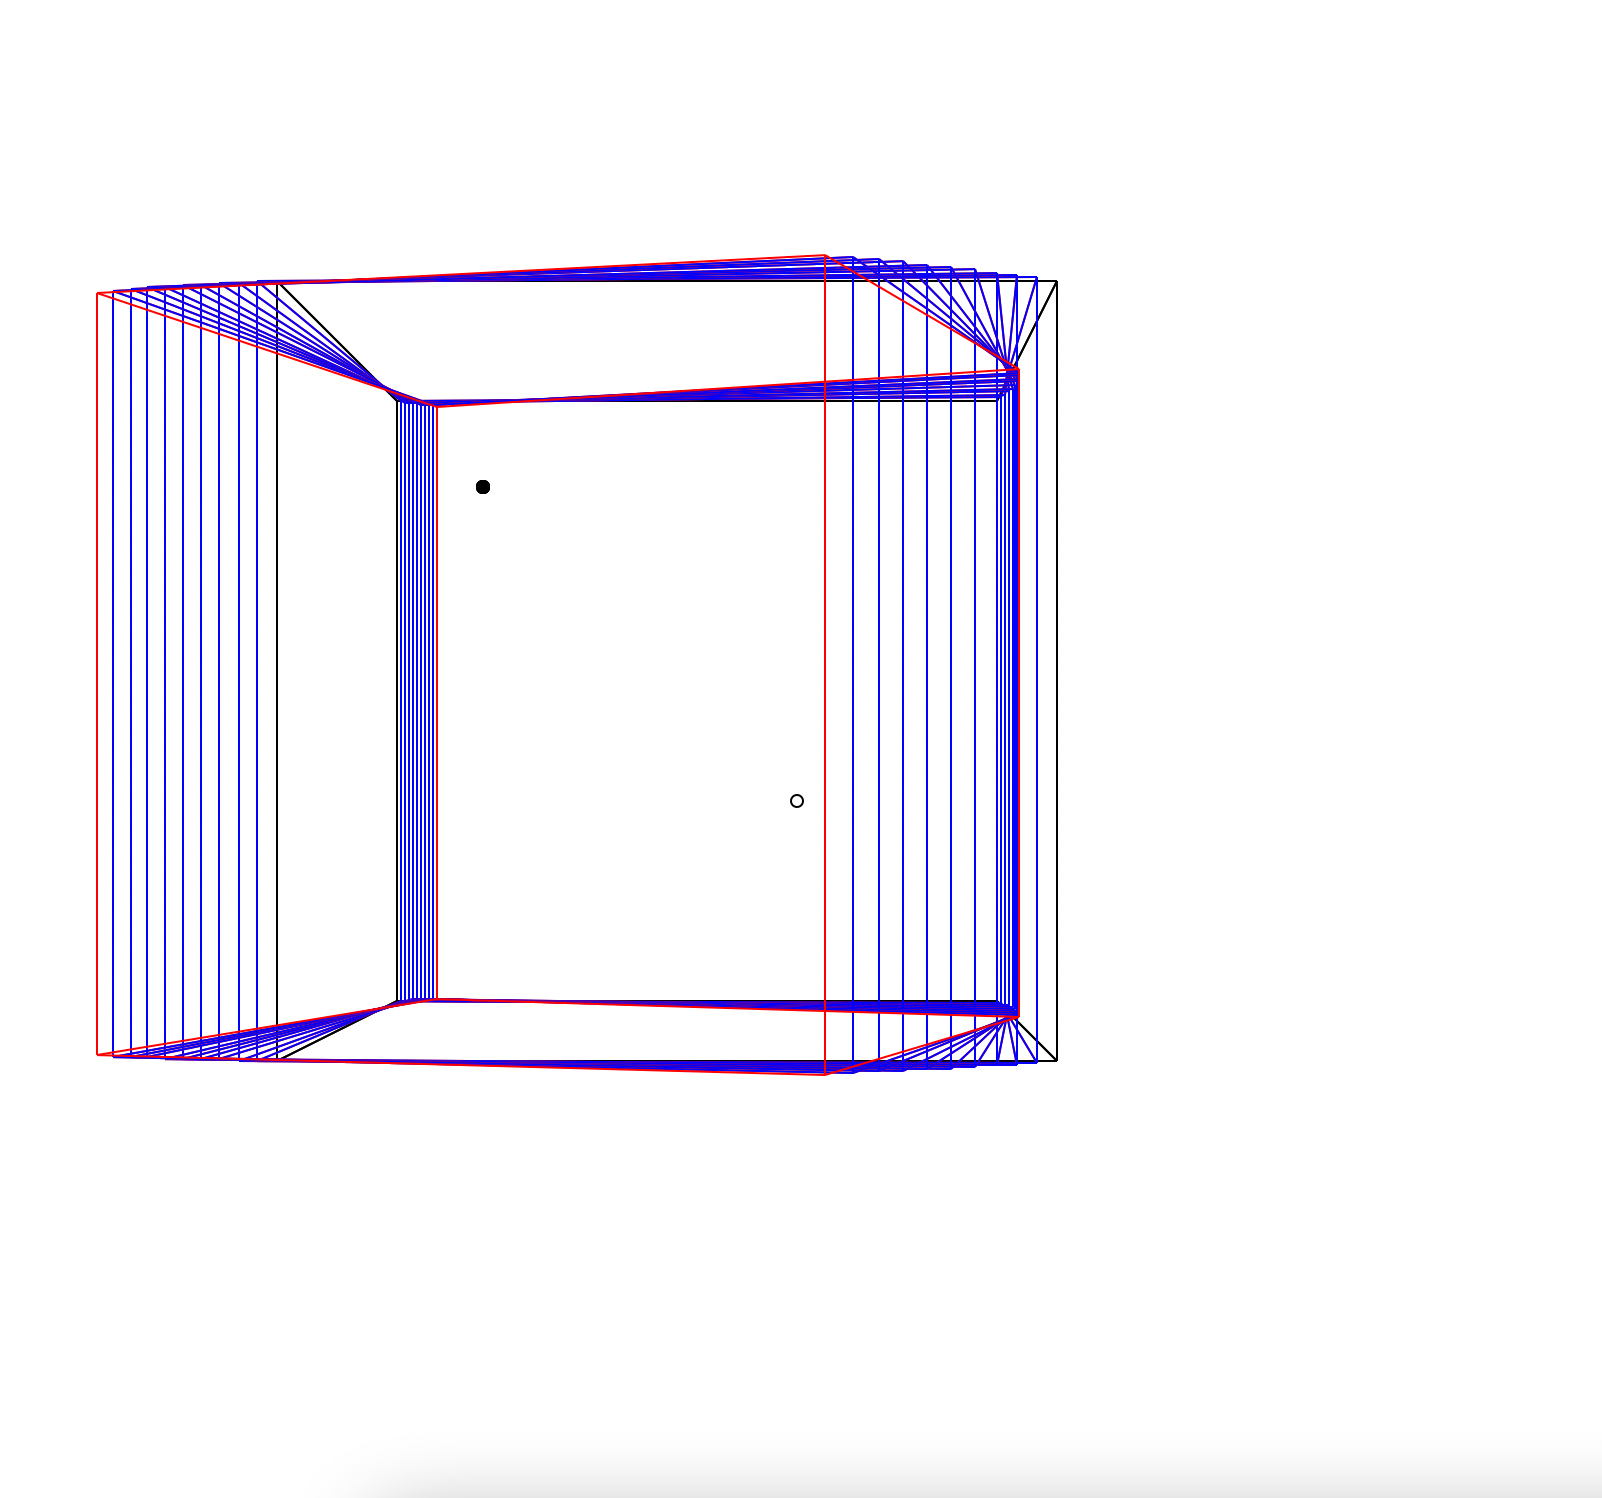
I wrote a program that attempts to display objects in 3D space, using a perspective algorithm, with the following method:
- Each object is stored as a list of coordinates in 3D space.
- Each object also has a list of 'lines' which connect the coordinates. These are stored as references to the coordinates' memory location, rather than actual value, so that when the points change, the lines move automatically. (In Python, this means I made the points objects, and the lines are also objects which have two attributes - their two points. I wrote another version in Javascript by having the lines store the index of the points in their list.)
- The object can be rotated around any of the 3 axes, by rotating in two dimensions in the plane of rotation.
- Objects can also be translated by shifting any of the coordinates.
The biggest challenge here was the perspective - I did some research but it seems the standard methods for showing 3D coordinates on a screen are beyond the scope of my understanding, so I used an easier workaround.
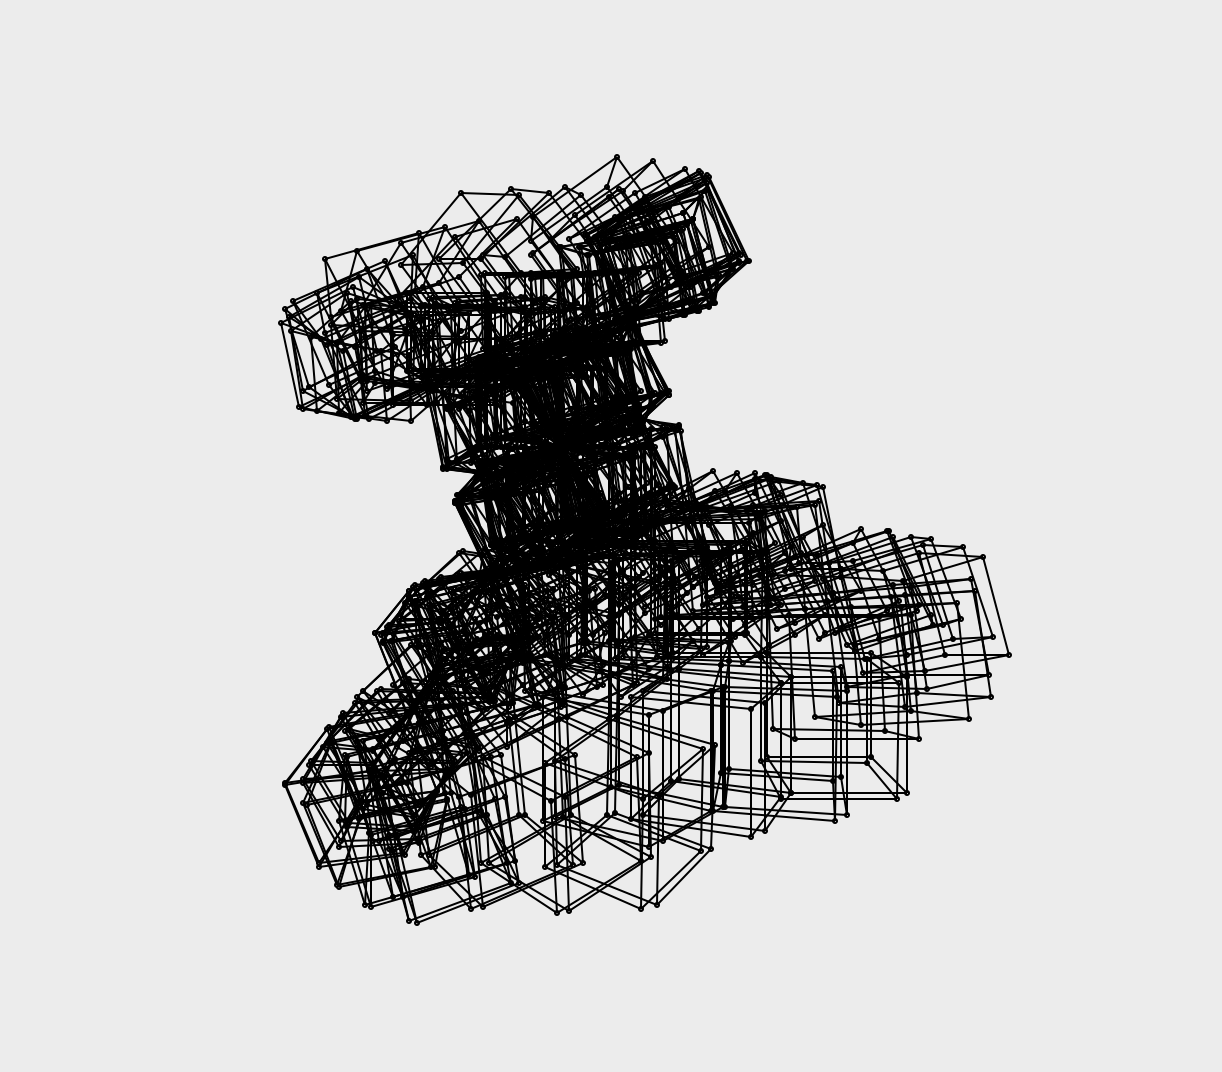
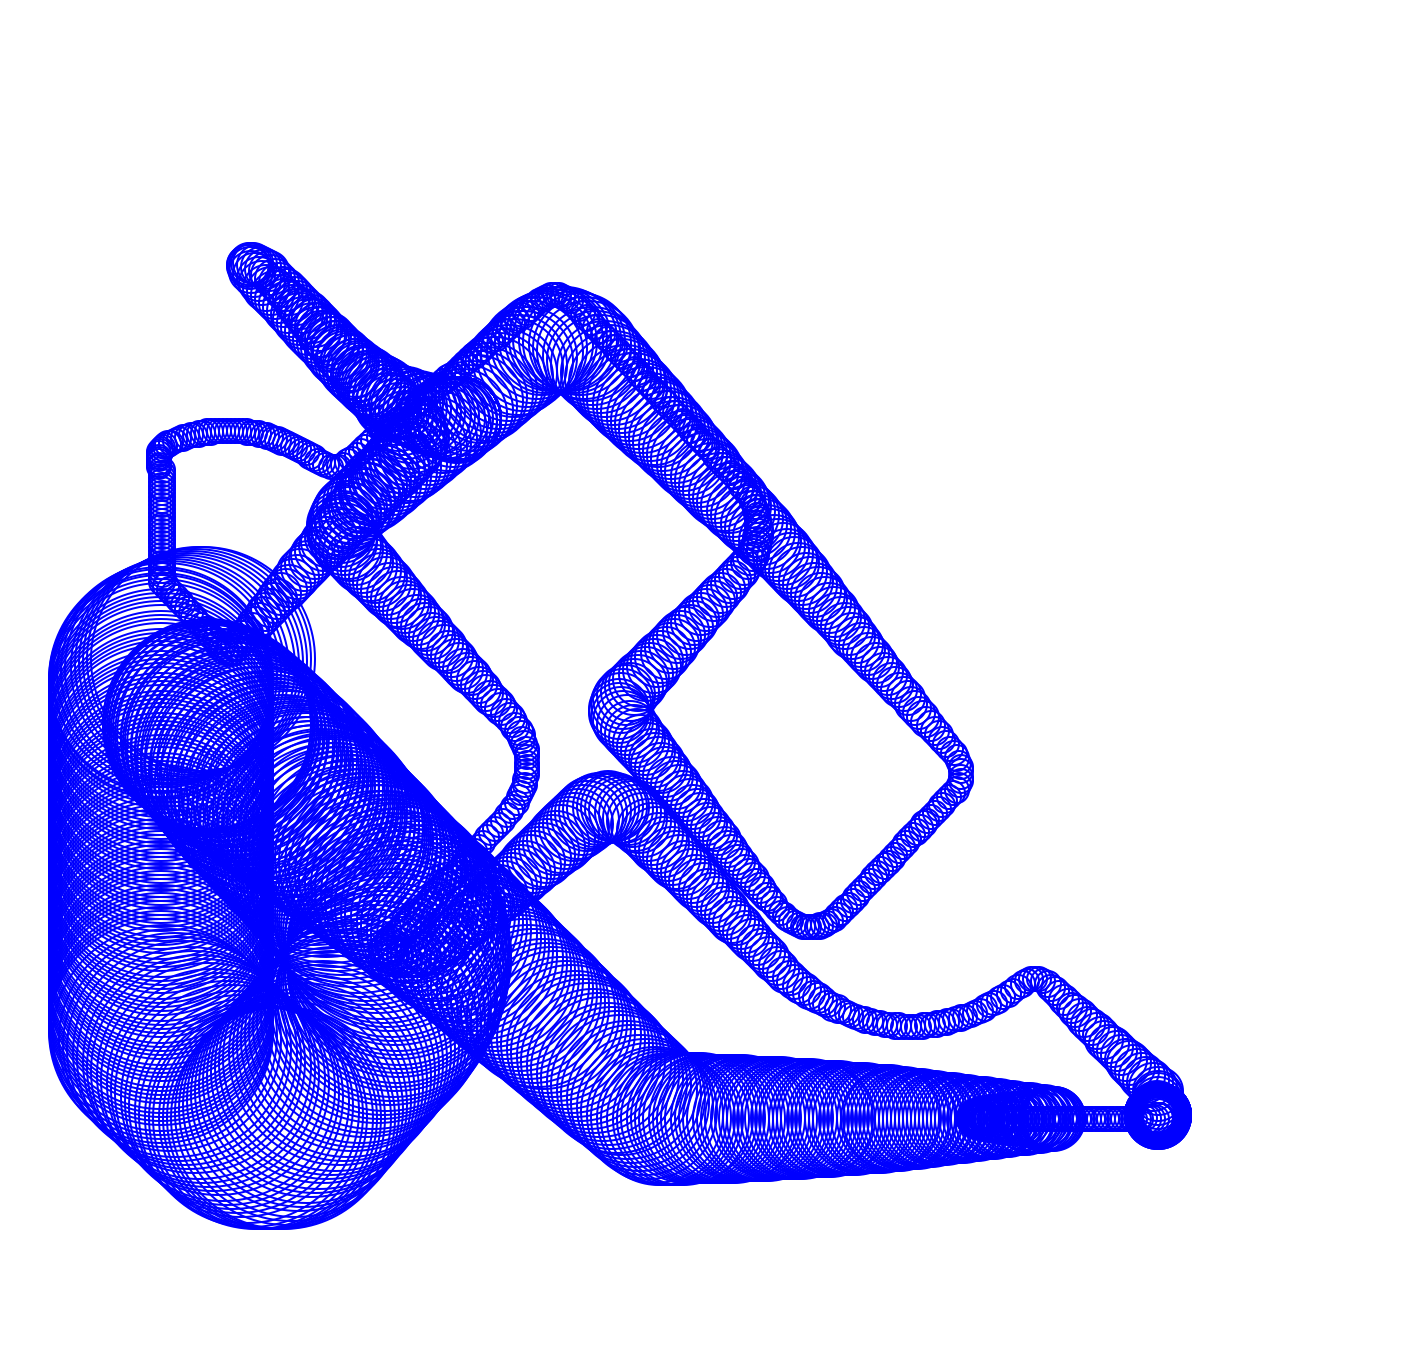
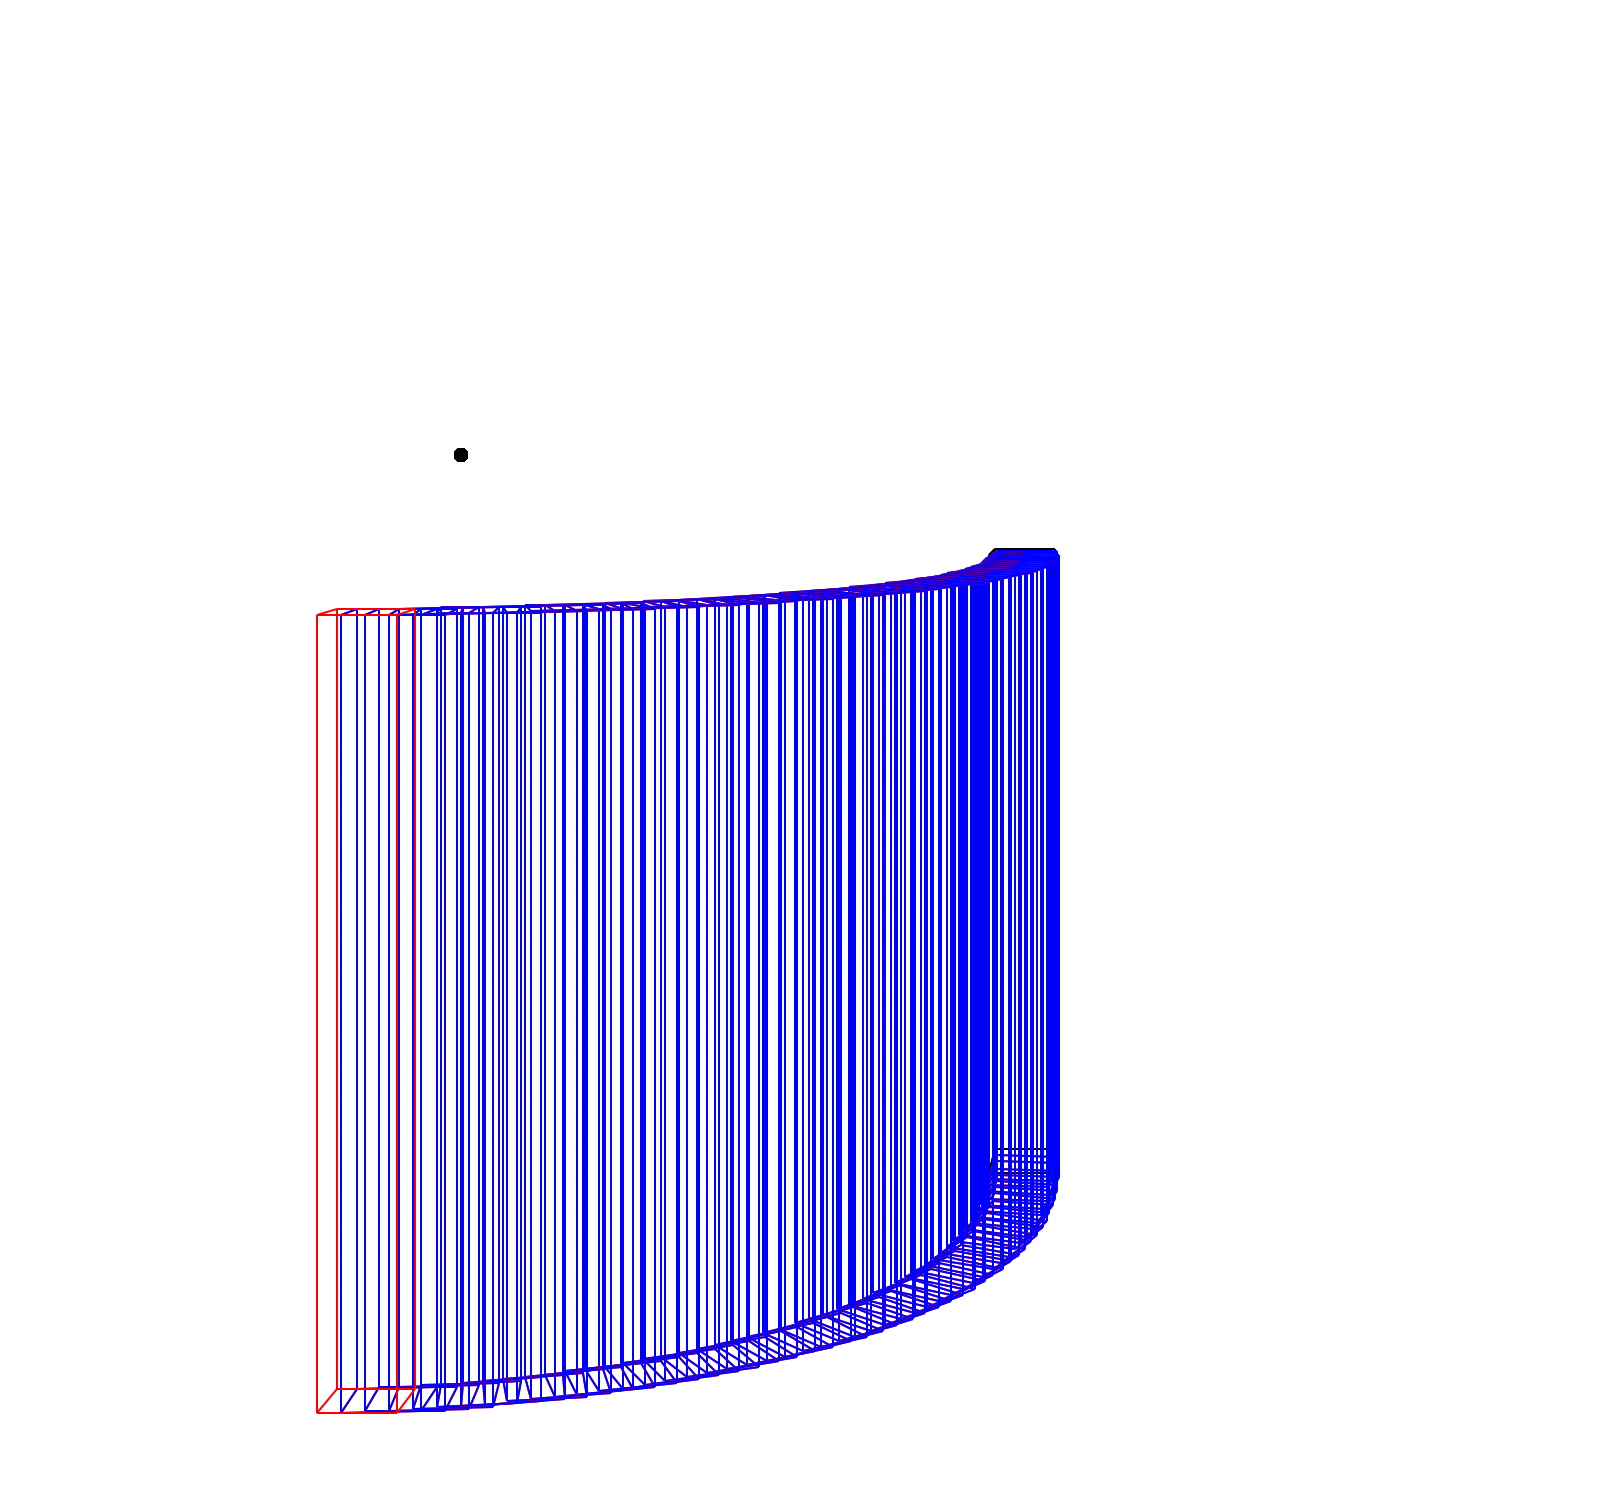
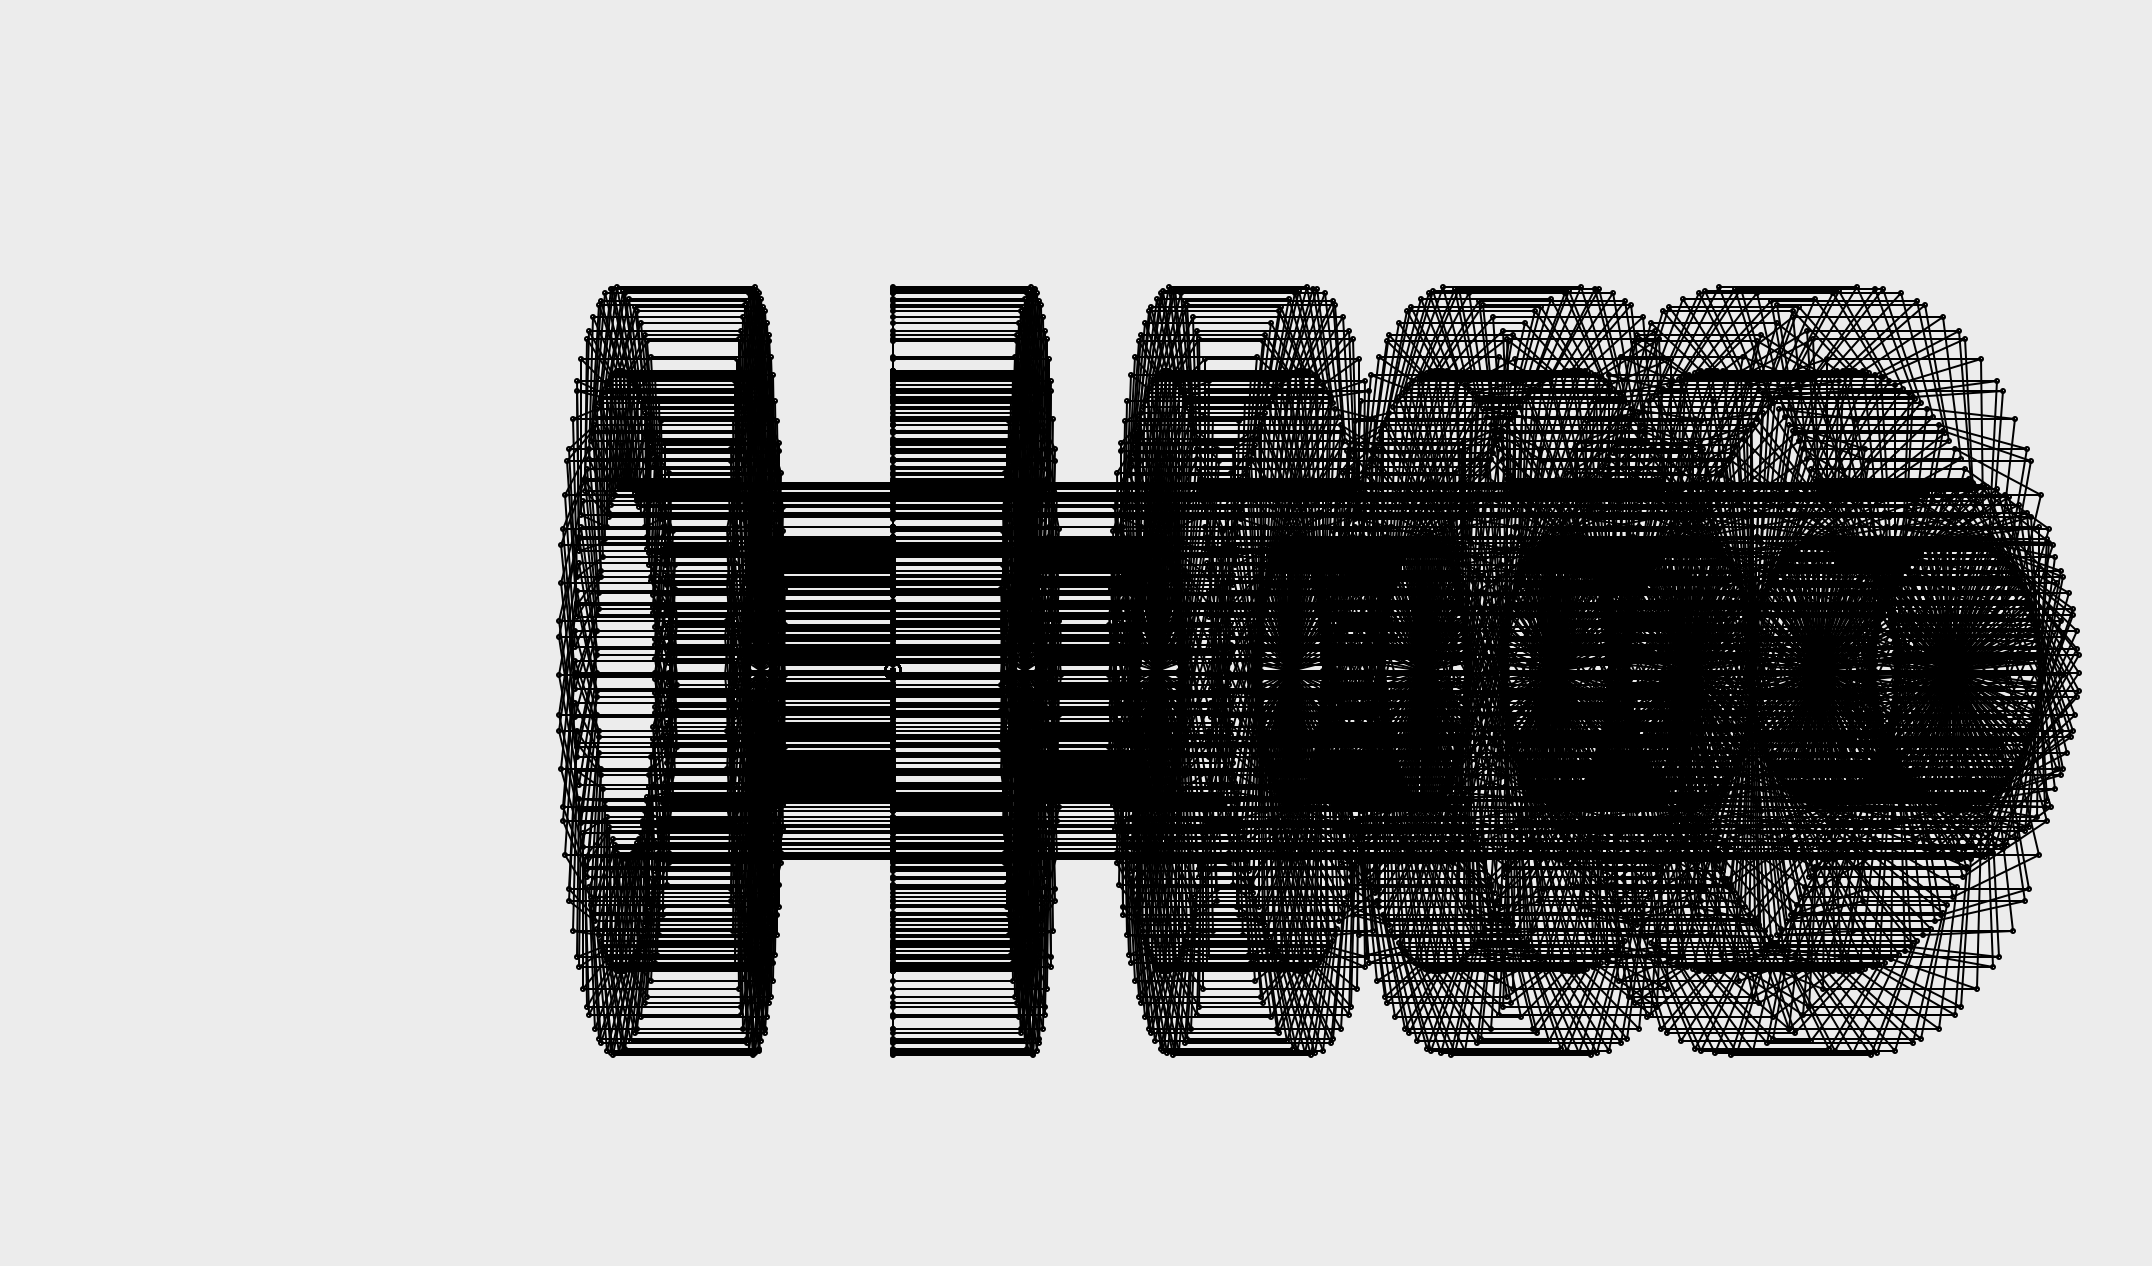
Here are some examples. If you hover over these images you can see their captions.
Rotation. The black dot is the centre of rotation.
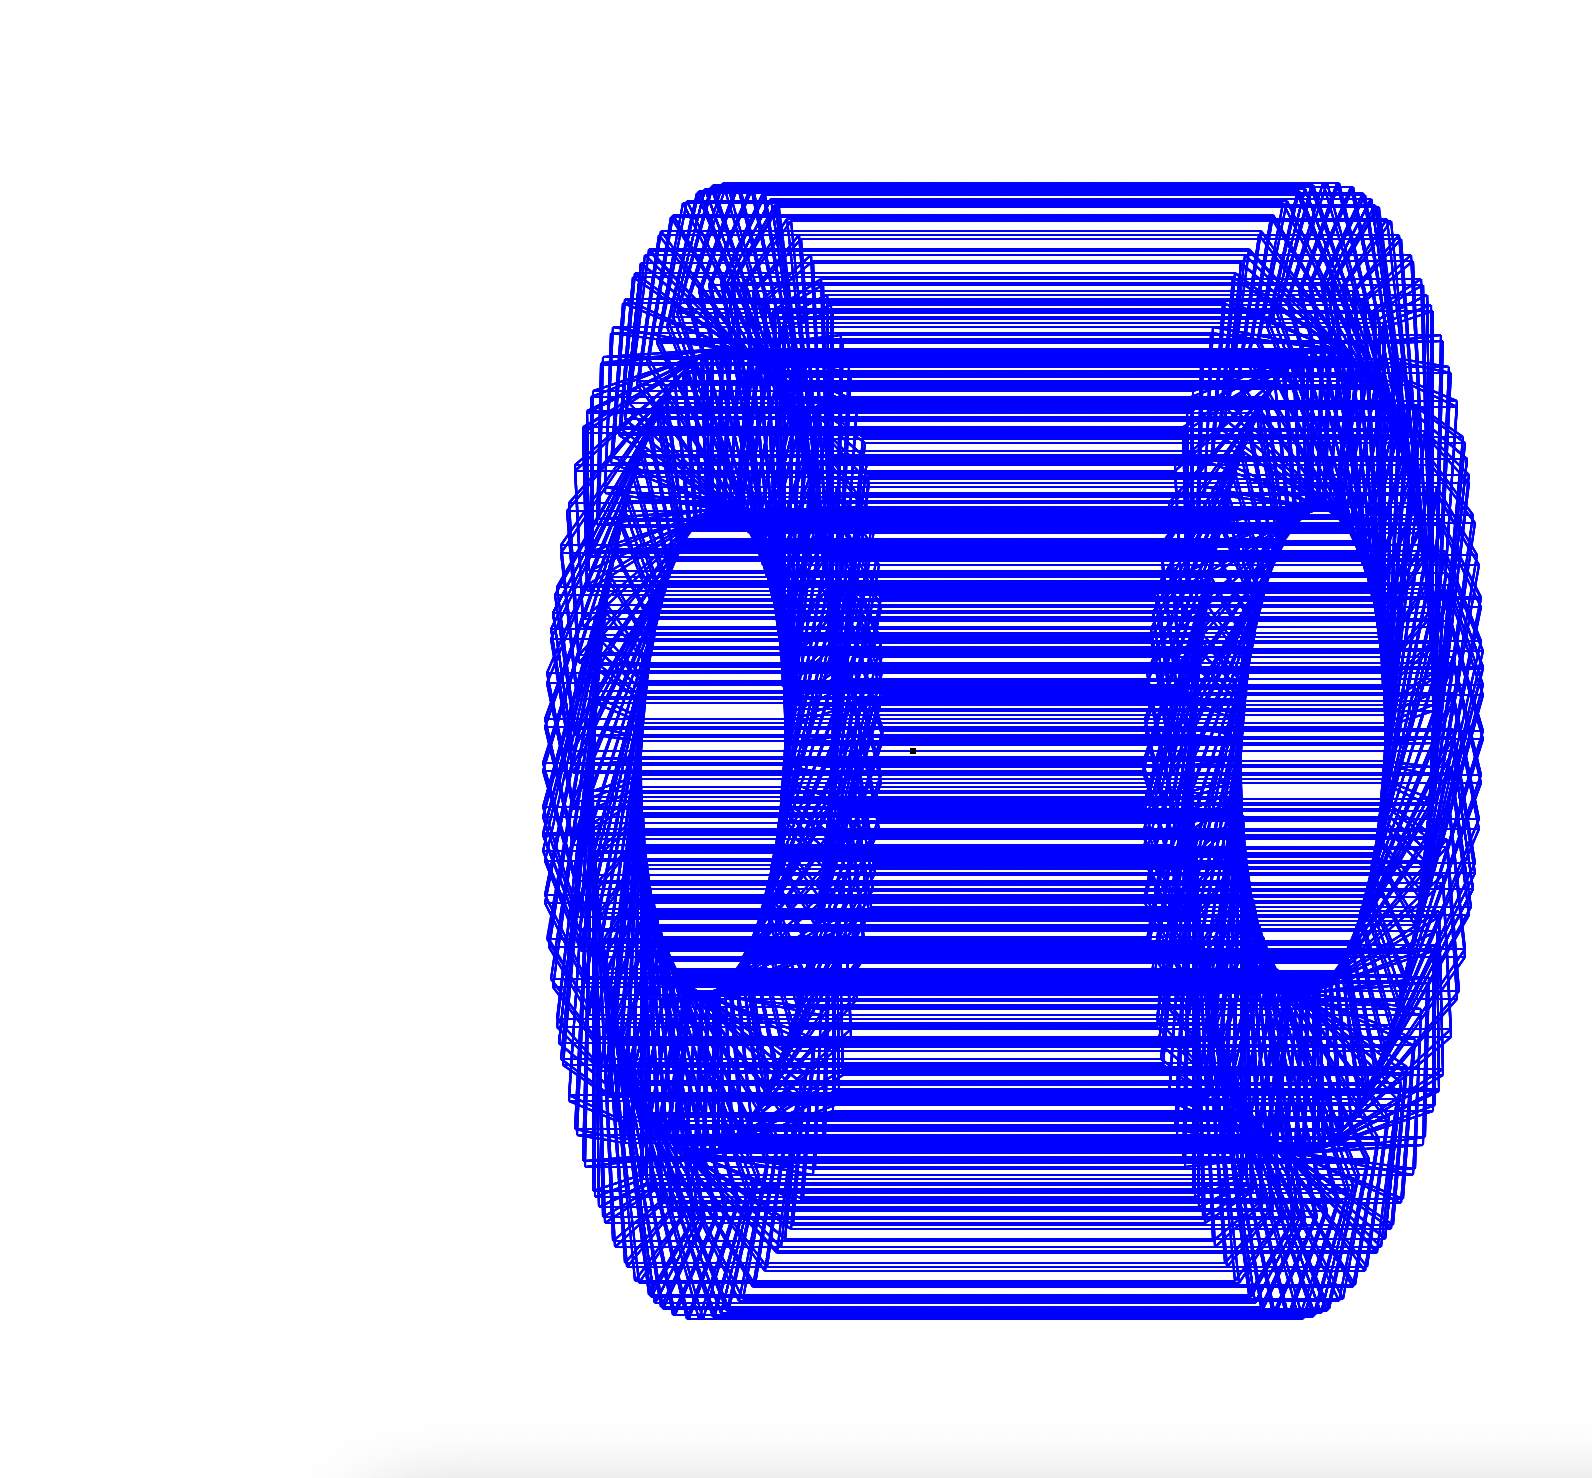
Rotation of a cylinder.
Rotation.
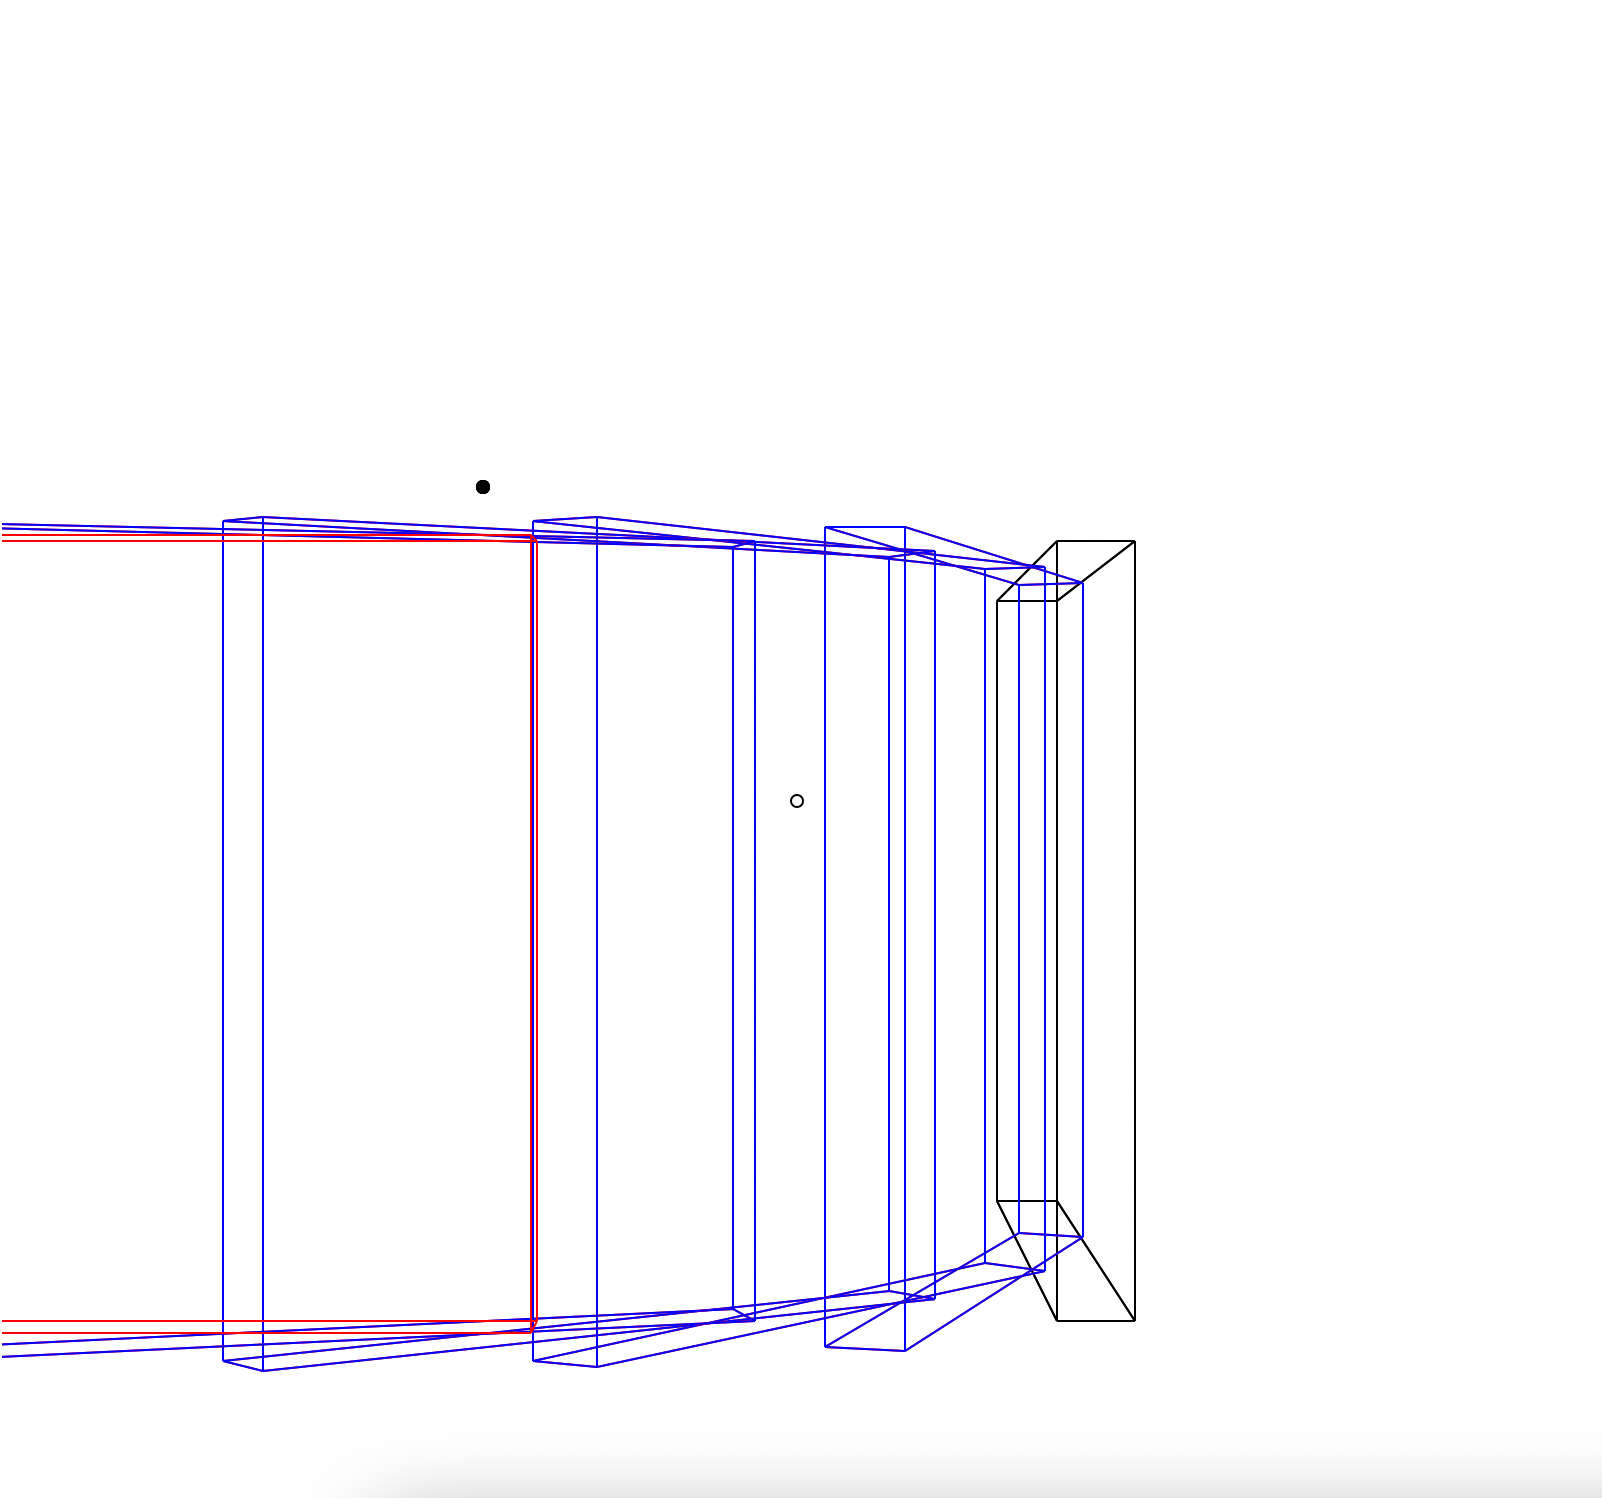
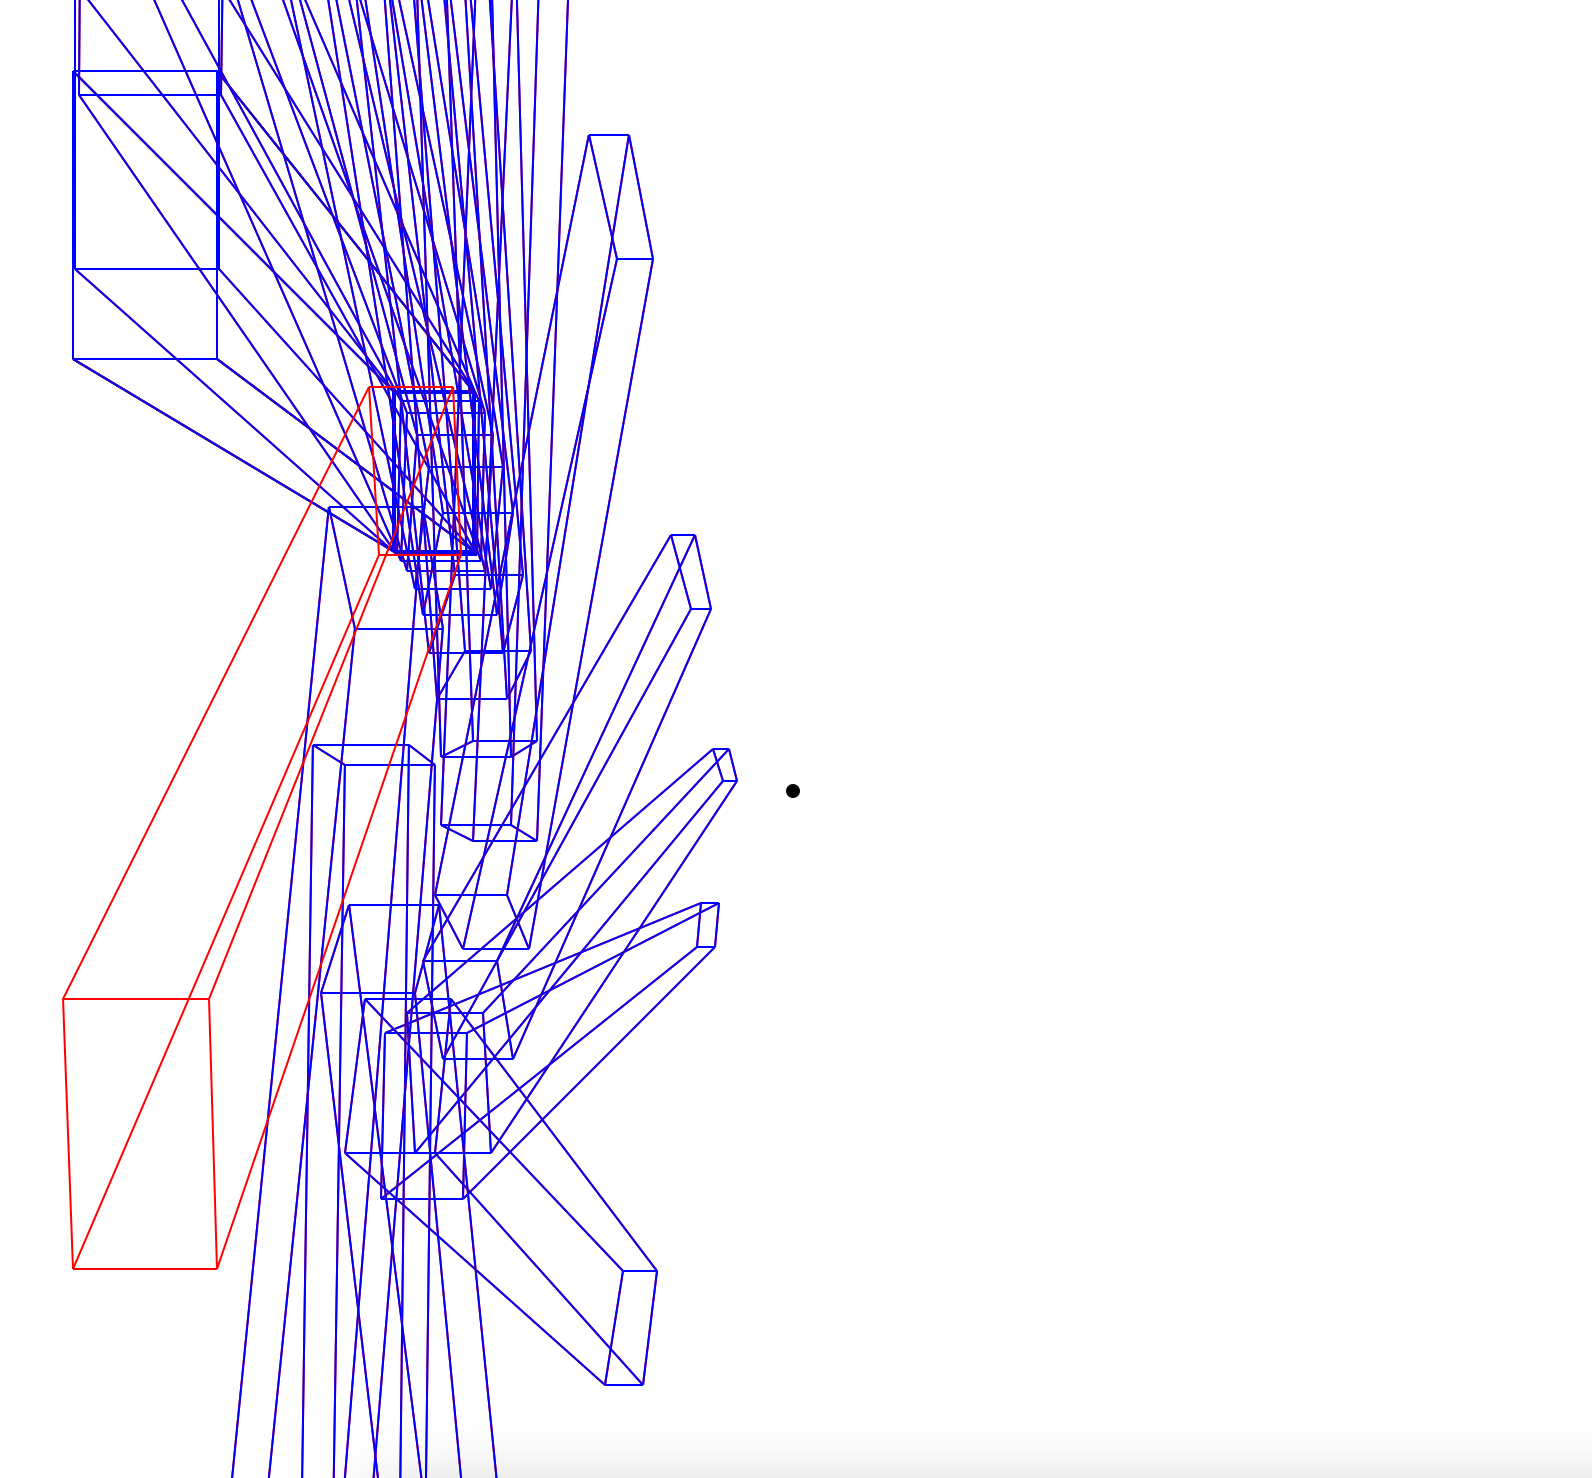
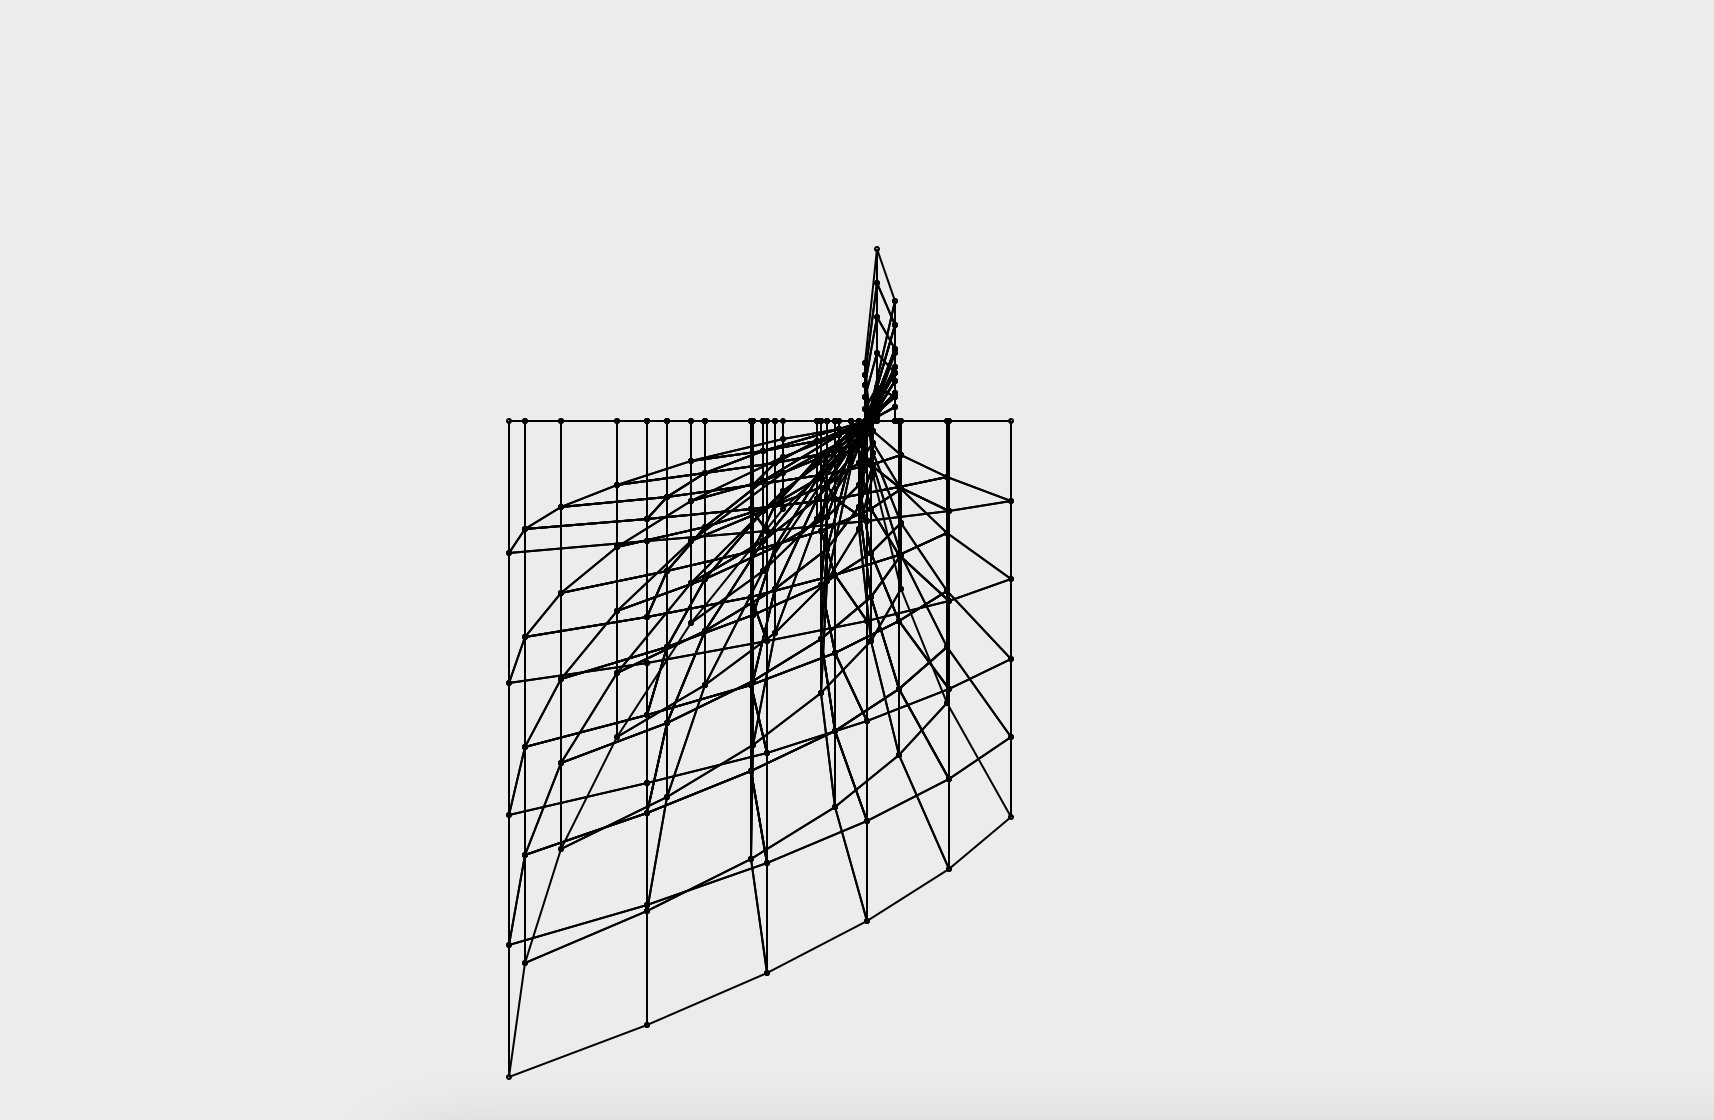
Both the vanishing point (black) and point of rotation (outline) are shown.
A number of translations.
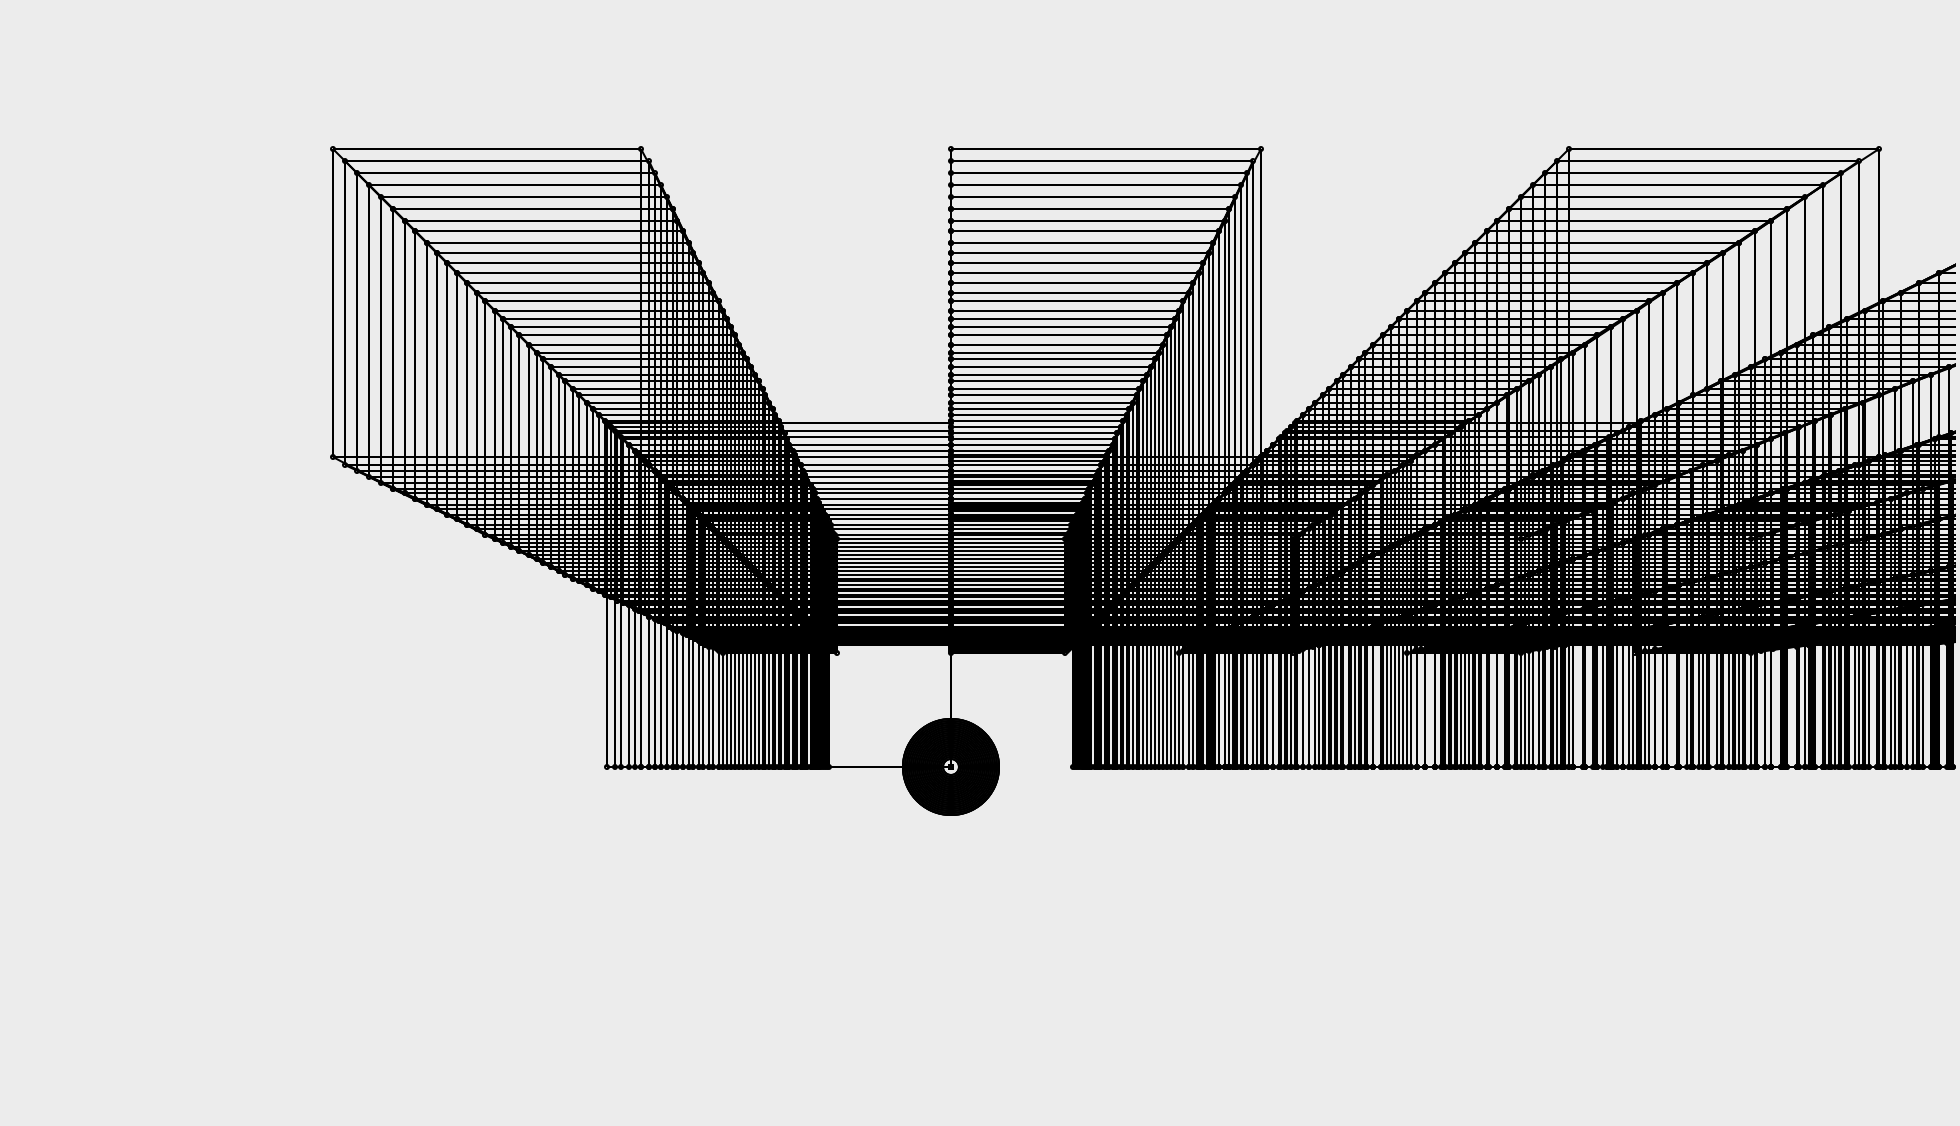
Various different changes to demonstrate perspective.
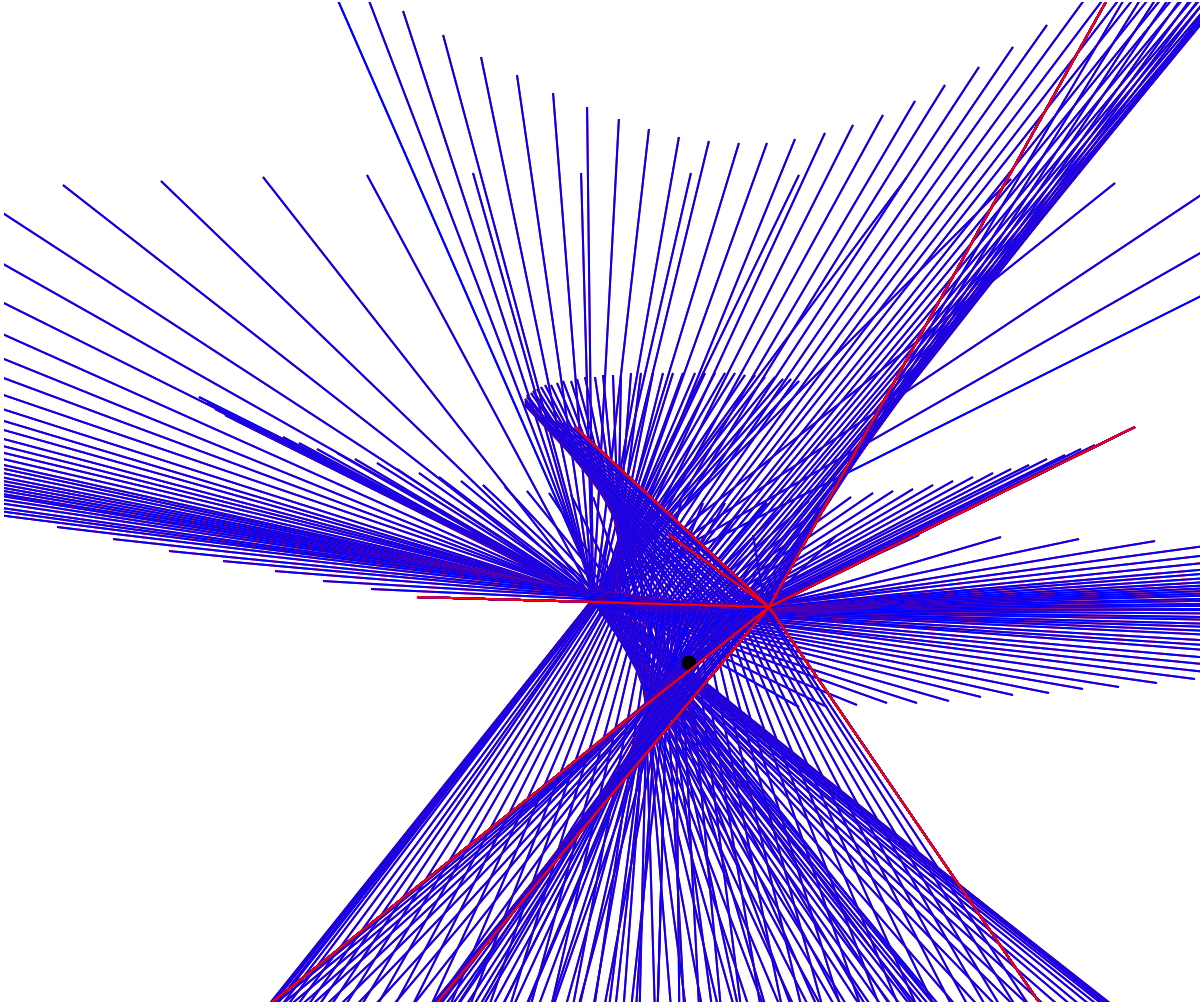
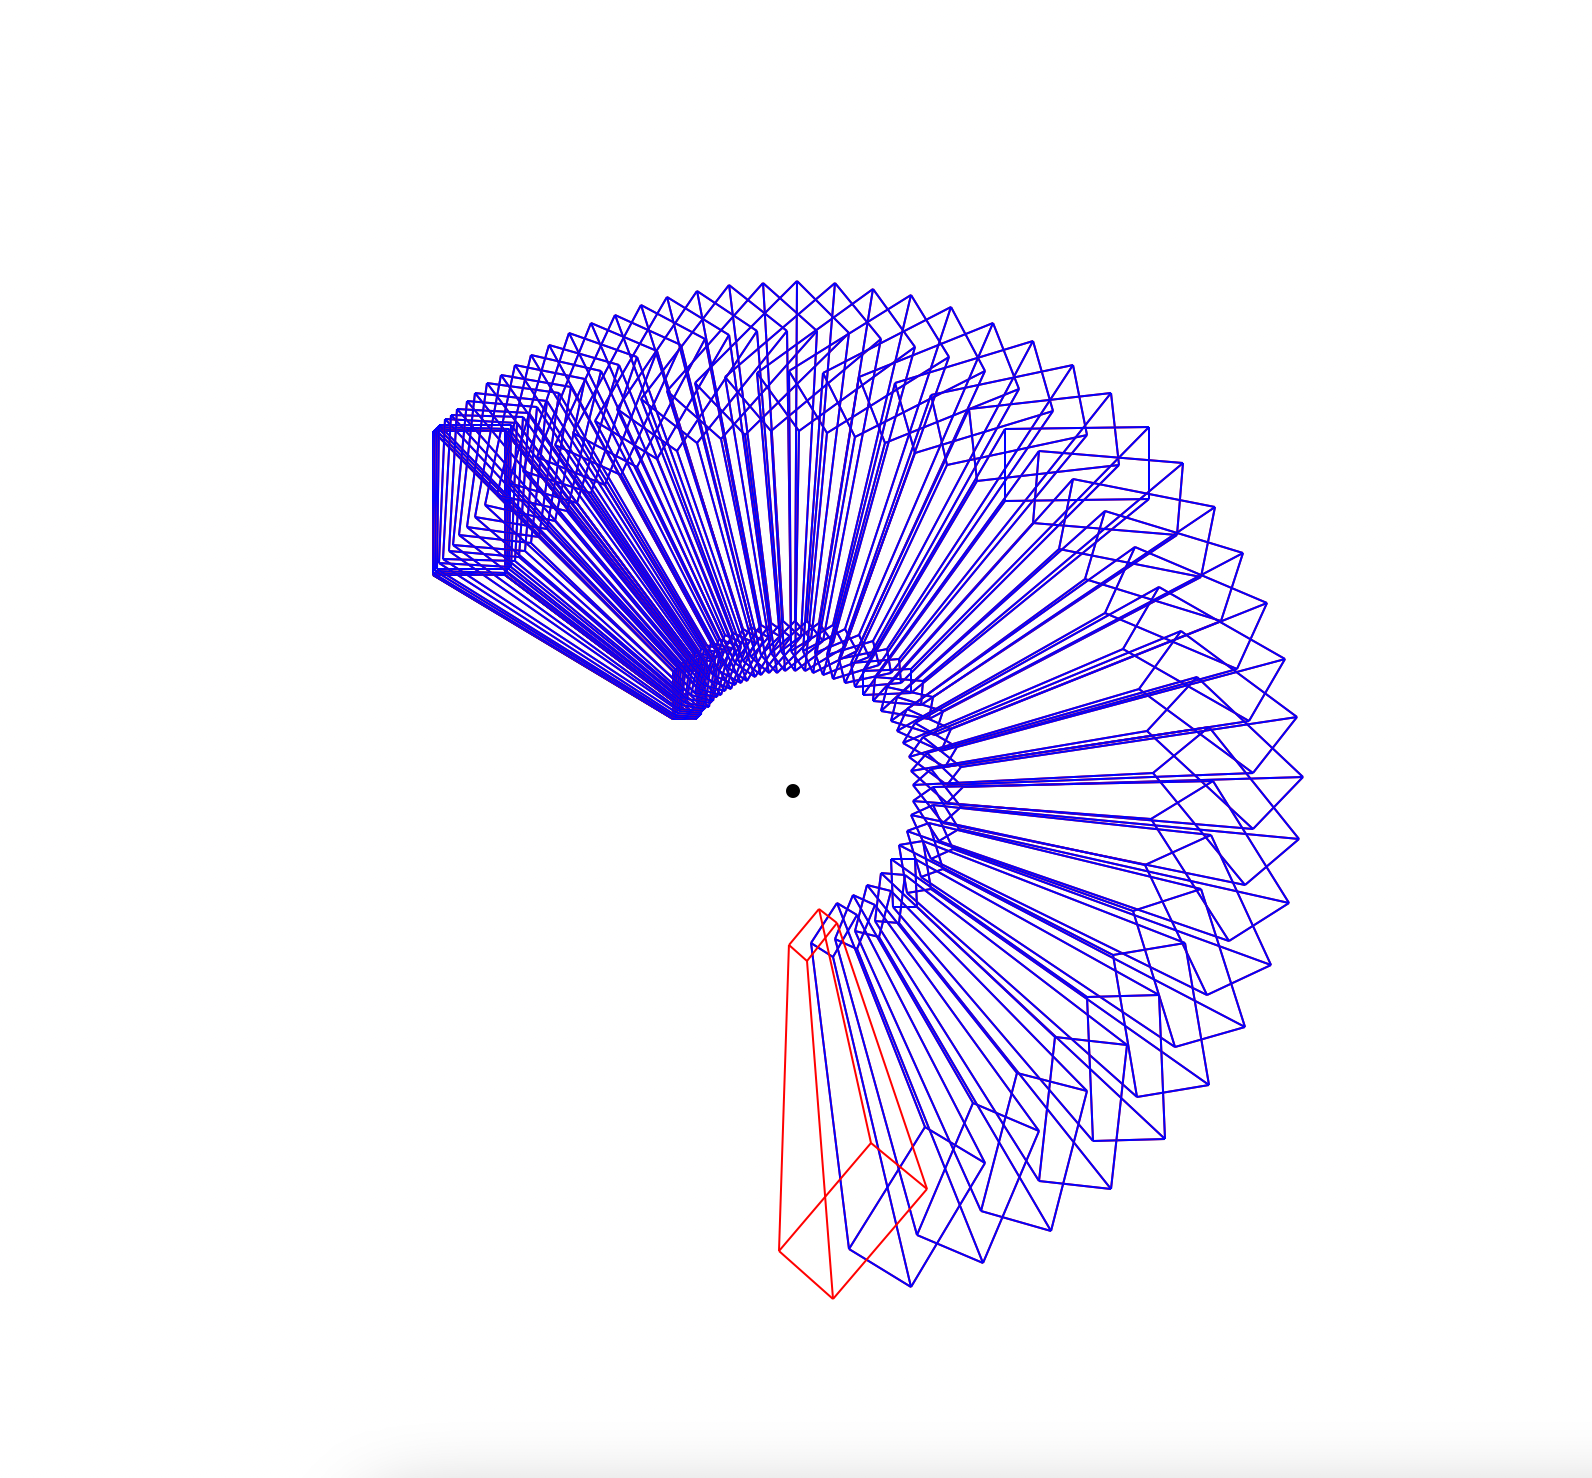
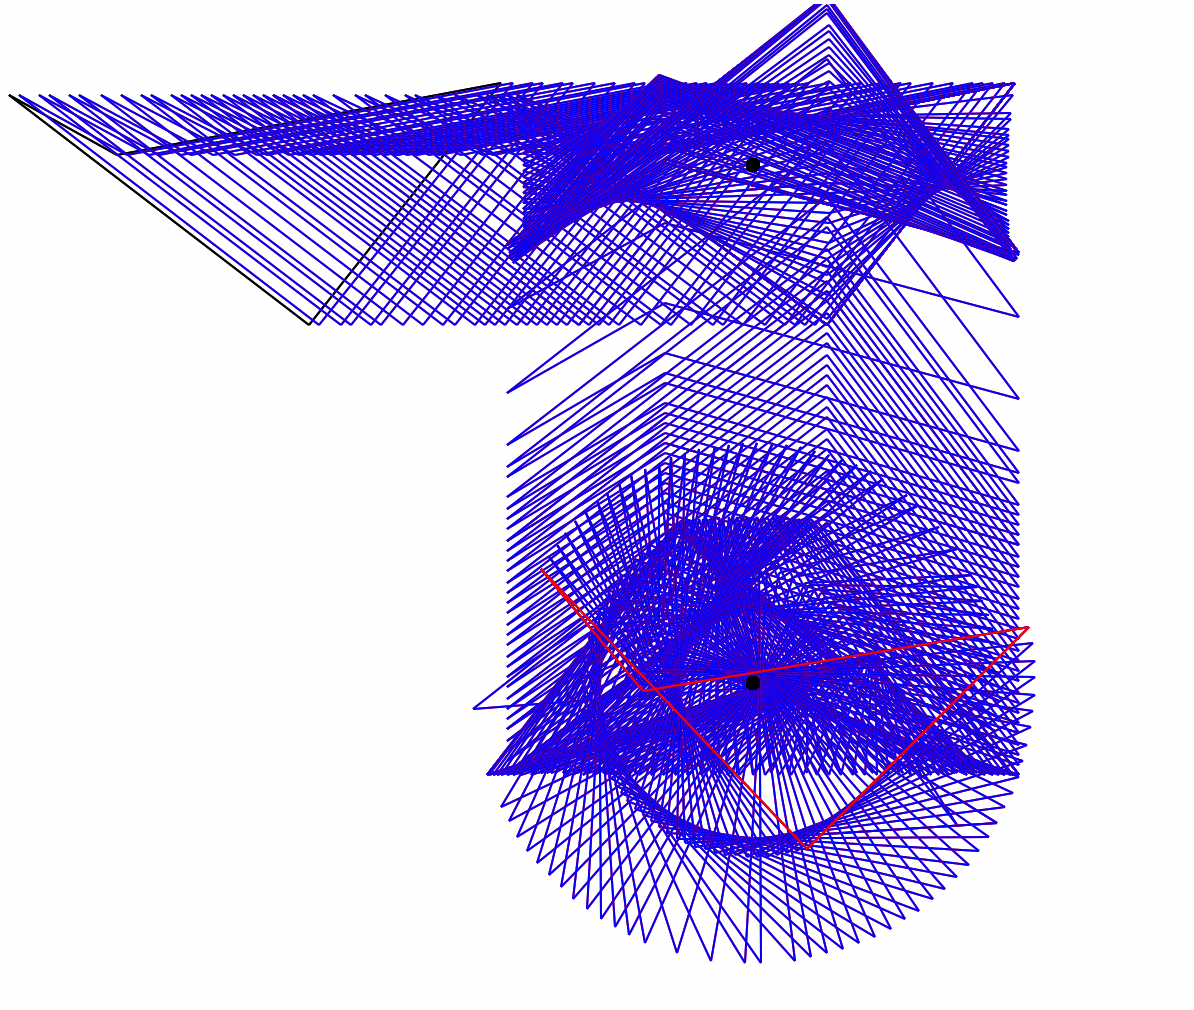
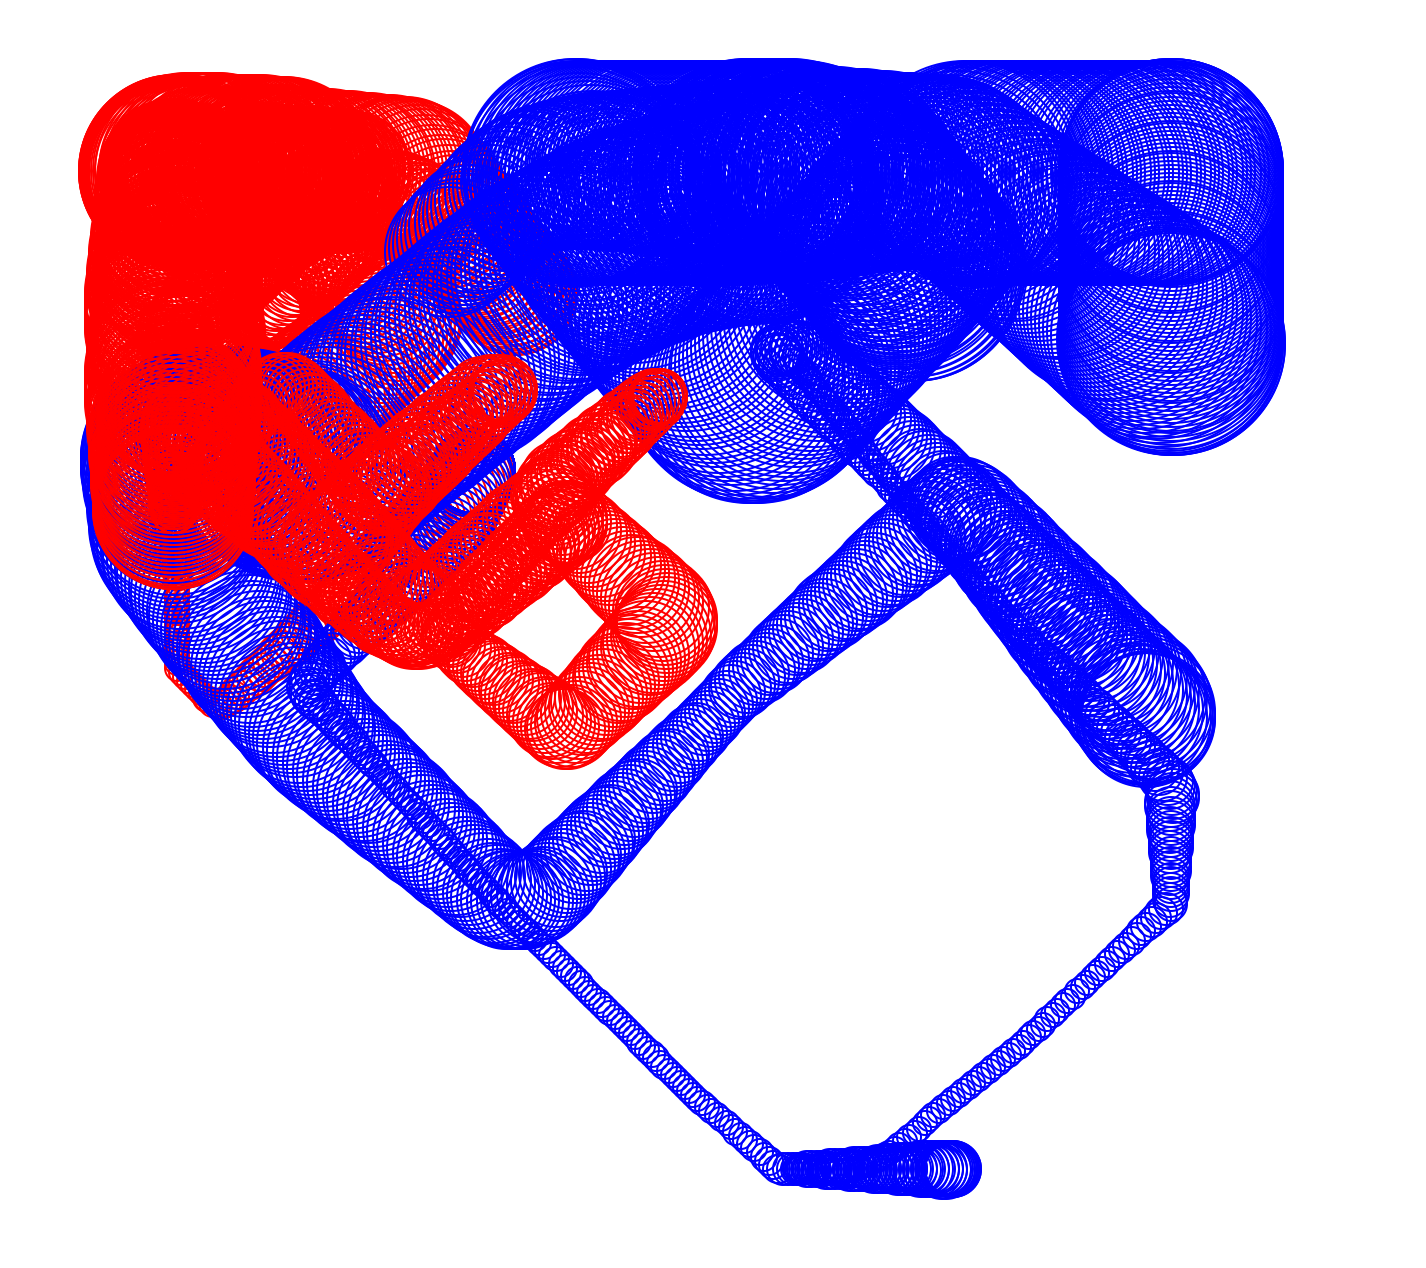
Rotation of a splintering line (look at the red line to see the shape).
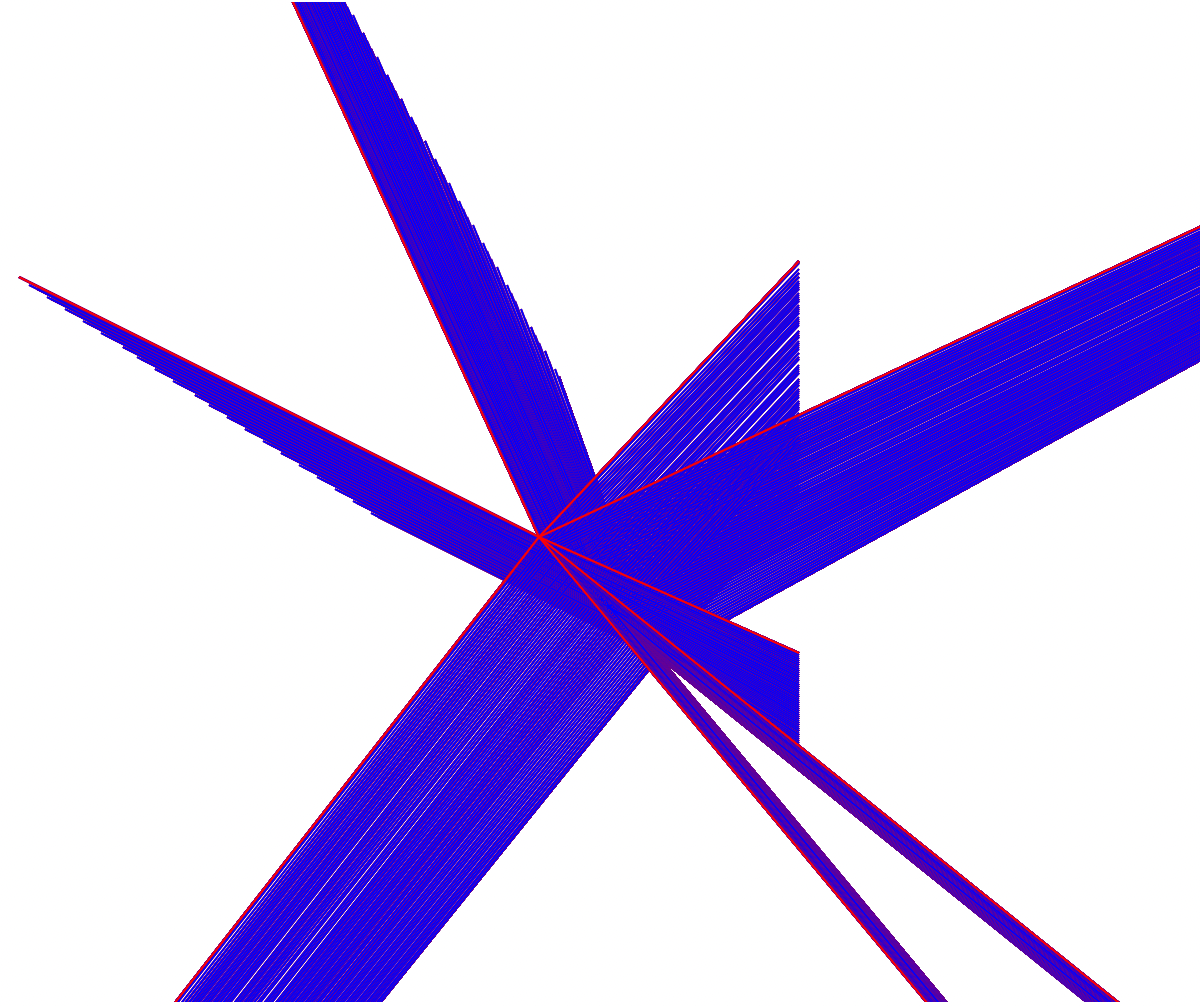
Translation of a splintering line.
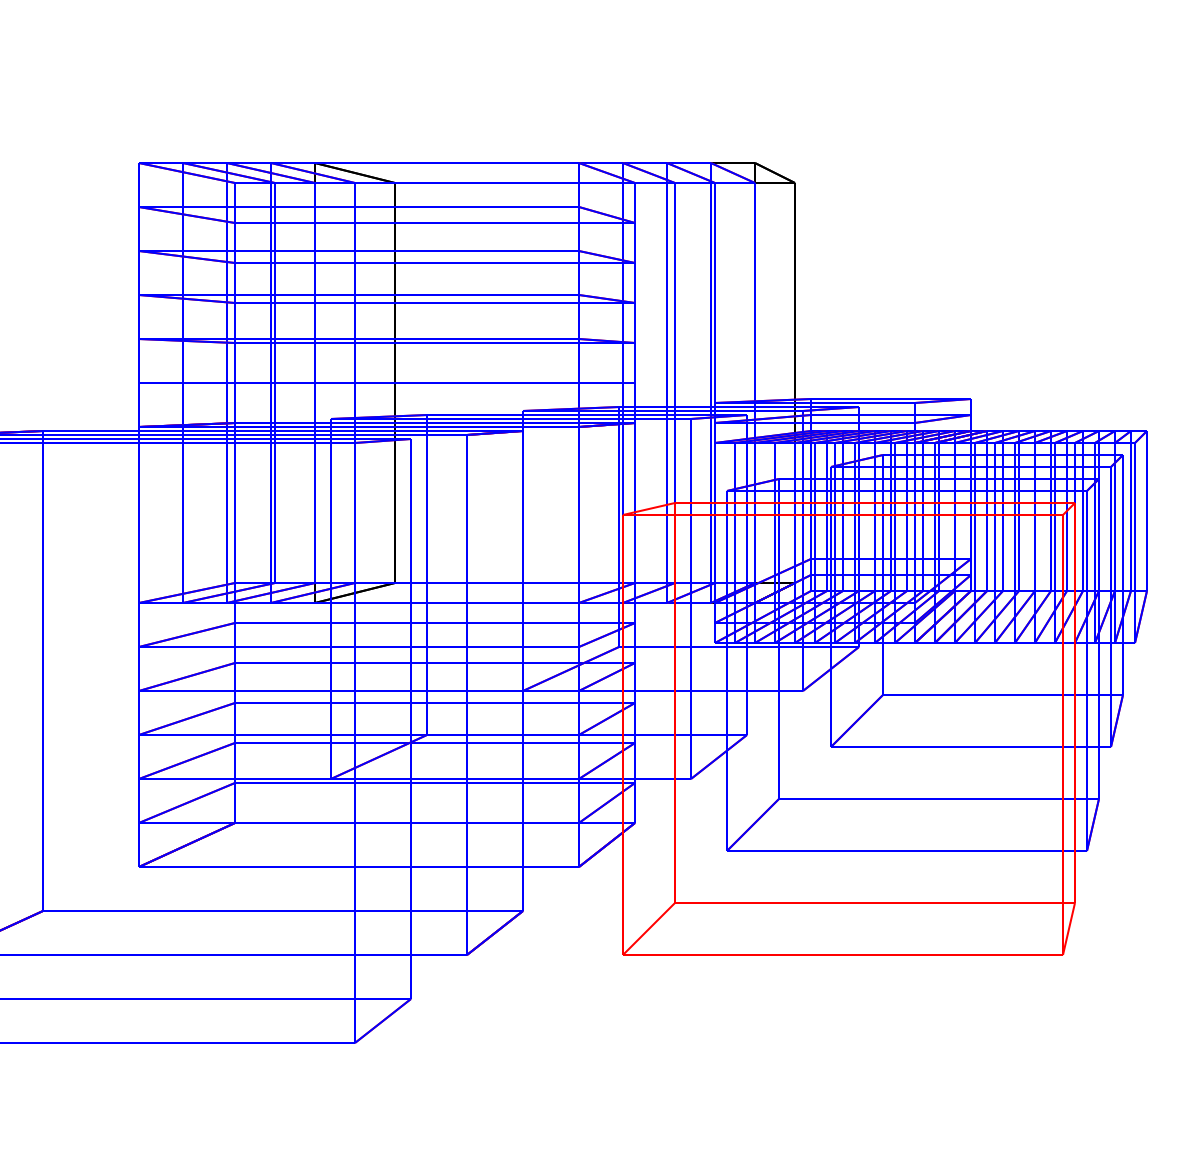
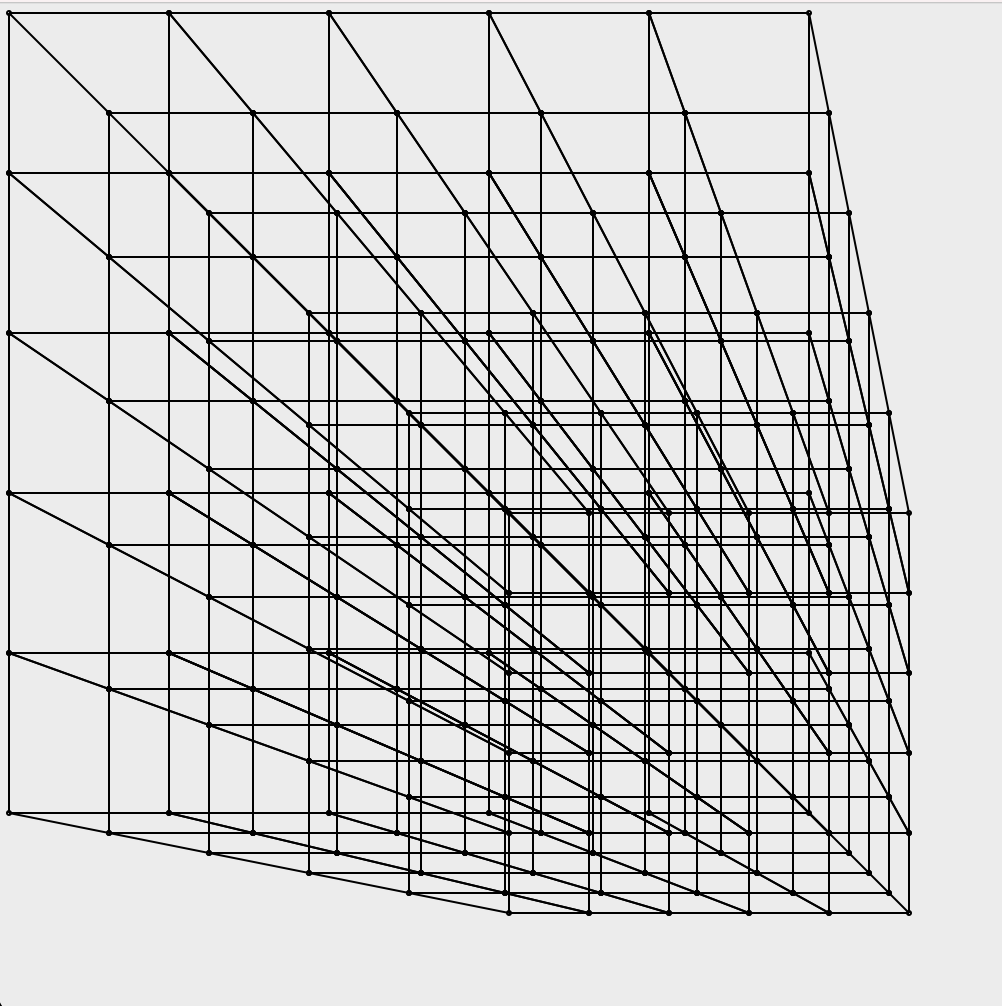
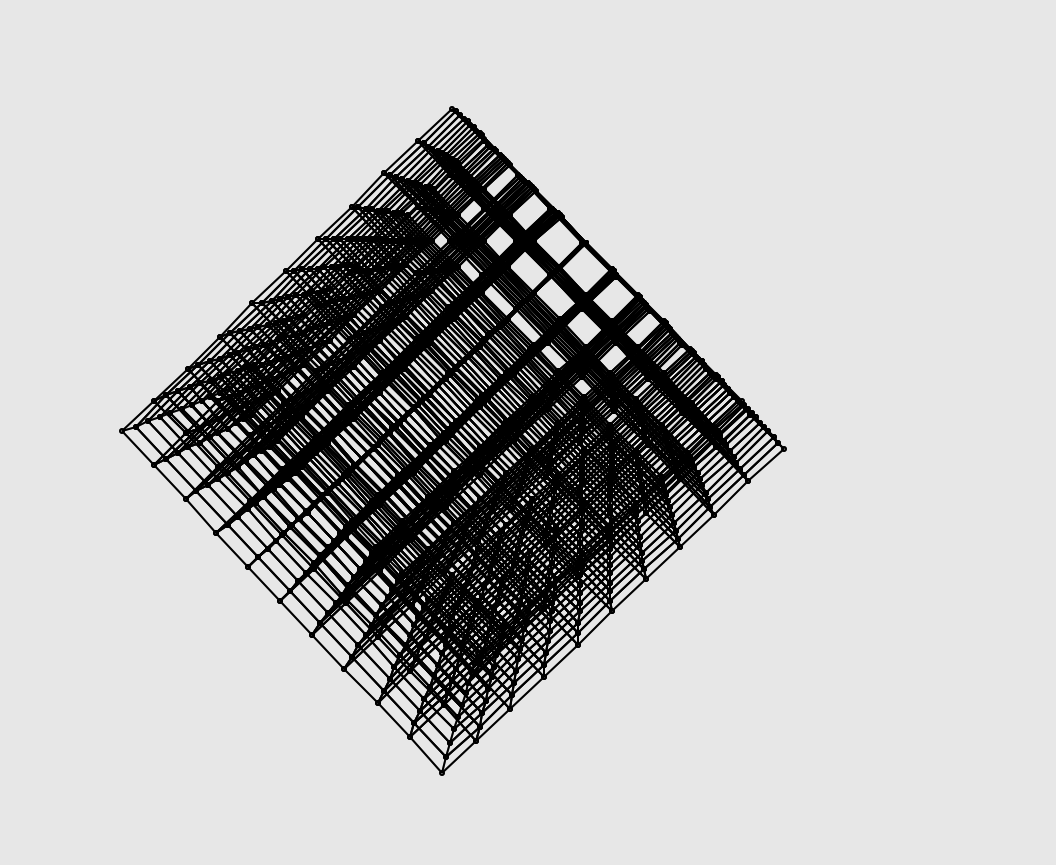
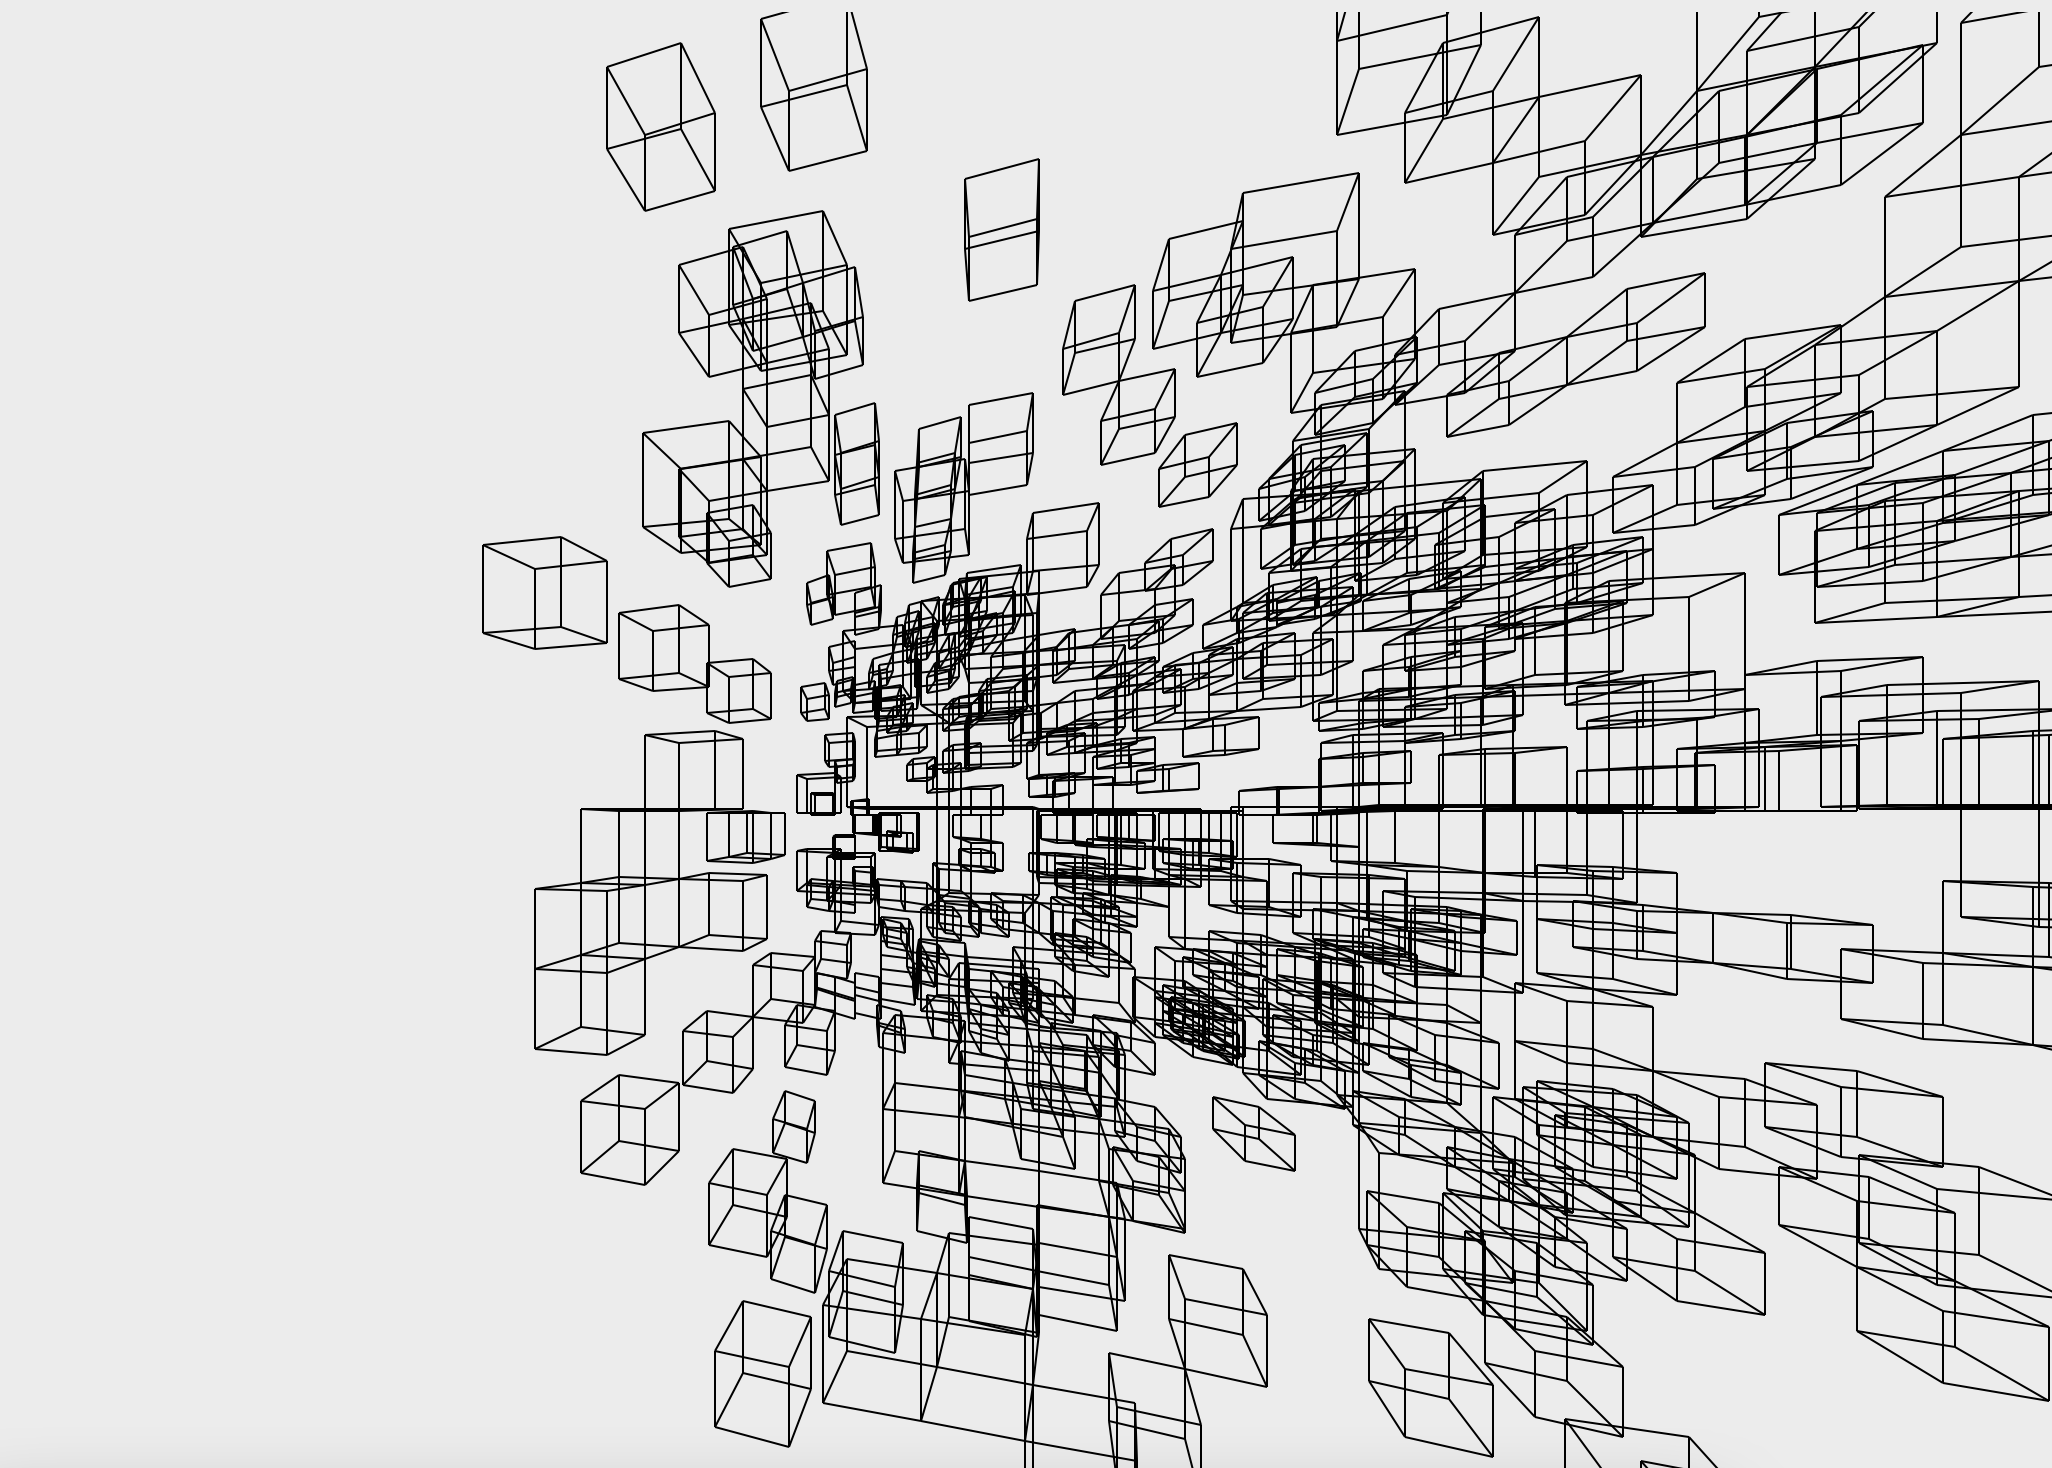
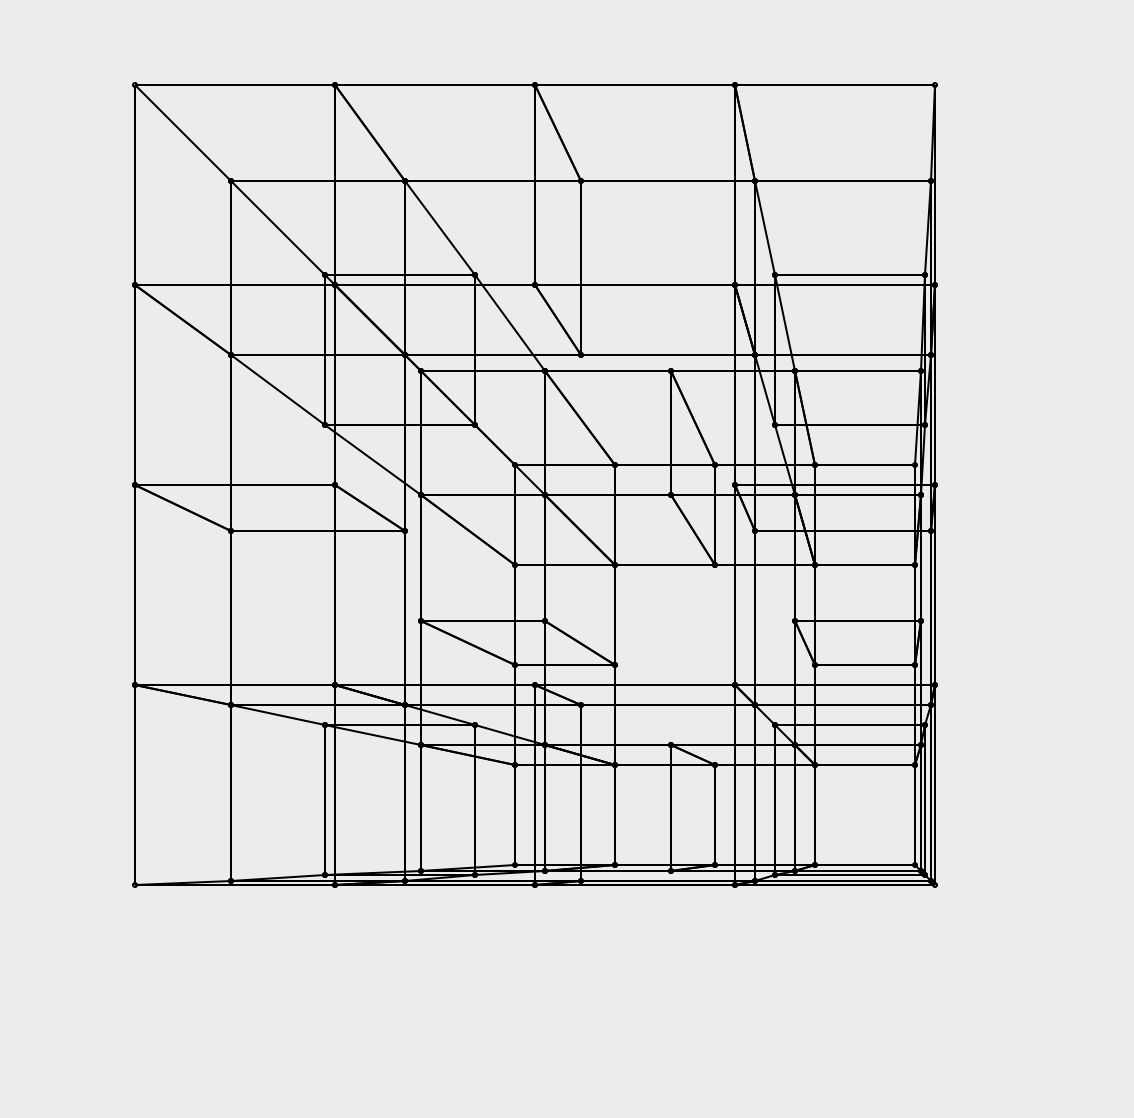
A second version of this program comes with an easier way to describe objects by building them from cubes. The programmer can describe shapes by writing a file using relative distances, for example, they can place a cube at (0, 0, 0), and all the rest of the details (all the other points and lines) will be worked out. In this program, the user can also move around.
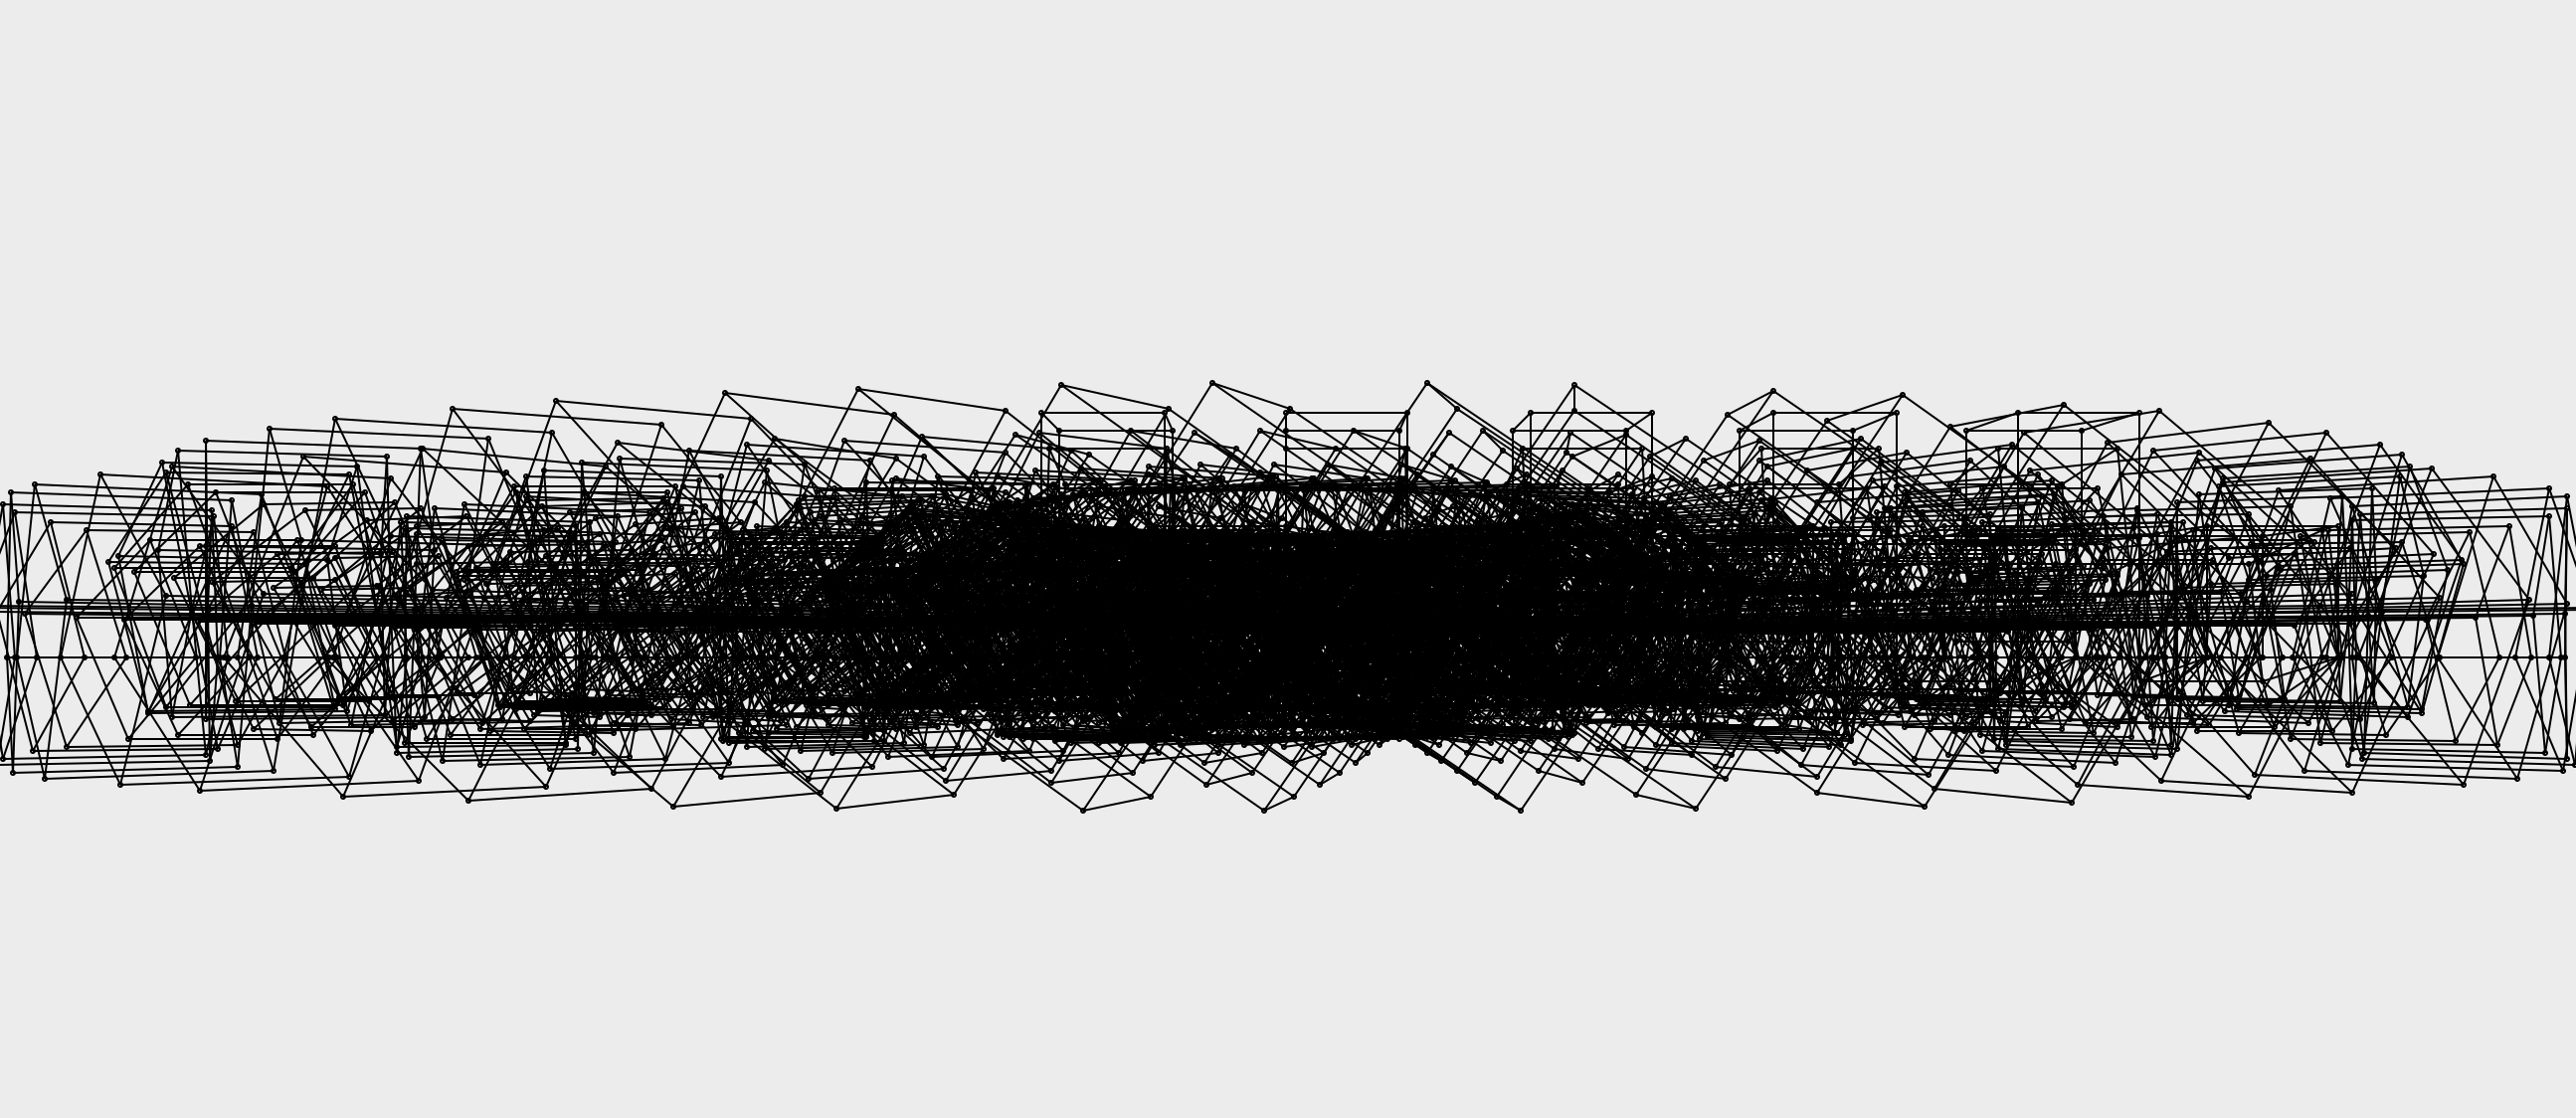
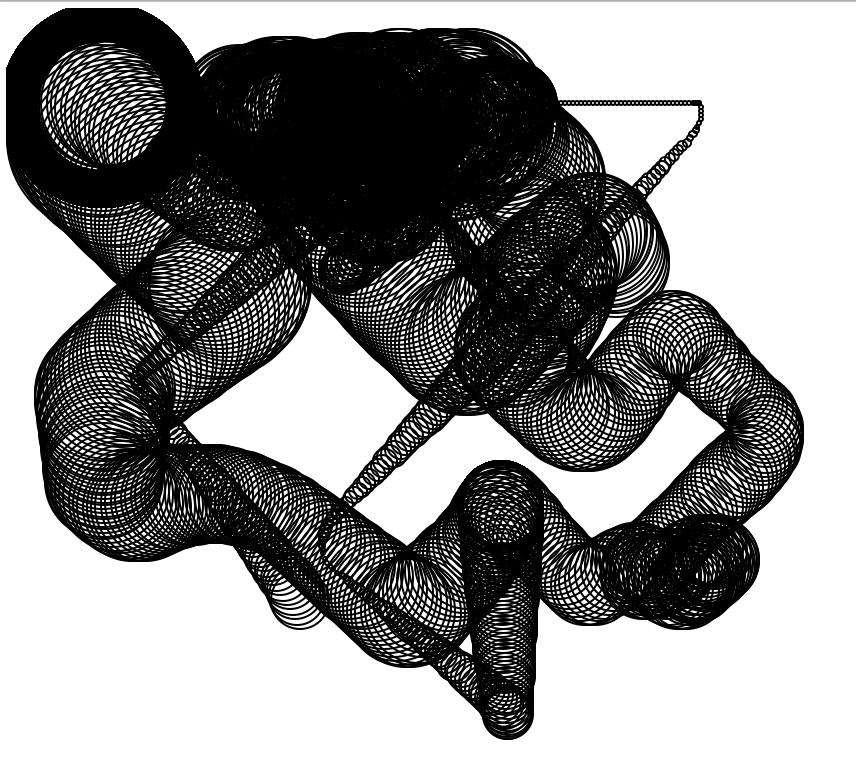
The following were made with various orbs that have a position, speed and acceleration. Their acceleration changes randomly as they move, and the position and speed are subsequently calculated at tiny intervals. In this program, I attempted to represent a 3D view by changing the size of the circle the snake created - a larger circle is closer to the user.
Predictive Text
This program analyses text which it is given and creates a list of all the words that occur, matched with all the words that follow that word, including their frequency. For example, the data for the word 'the' could be: 'house': 5, 'hall':2, 'end':1, if you had text which followed that pattern. This can be used to either predict which word the user will type next once they type a word, or to generate paragraphs of text in the style of the original text. When choosing words in this style, the next word can be chosen either just as the most frequently occurring 'next word', or it can be chosen with a probability that corresponds to its frequency, so if the following word is 'and' 40% of the time, 'and' will be chosen 40% of the time.
The result of this algorithm is something like the predictive text option on a phone, creating sentences that almost pass as writing, but make no actual sense. For example, this is a passage generated from the Bible, which I chose as I needed a large body of text that is freely available online.
Then said she sat down within and raamah they could not one wheel by the hand so and when she was son of alexandria an abhorring unto the men of pedaiah the kidneys of israel this was a fool to this world that it shall offer every one among the tidings came jesus went up and went he poured out of gold that taketh them. Therefore they might stand upright is abomination in law said moreover the fruit thereof and his word of the heaven. At that are not performed my heart shall come let us not unto him the lord my net brake through the lord will fetch jephthah judged out from the lands and they sinned and i have known unto the oracle; and abiathar: and the kingdoms of affliction and he spake of berechiah; and walked in all things say unto gaza also said unto another on the gospel of thy soul and they not me. And glistering stones that she gave the name of his mother: that speaketh a snail and he attained not be turned to the lord; as uncircumcised philistine cursed be consumed: it was sore wounded them and forthwith the marketplace and he judged israel saw him. Then shall your body or be ashamed neither will be his: and david was in me there they poured upon his daughter: for thirst.
Here is some which was trained on the Communist Manifesto:
The development of machinery revolutionized industrial and is a portion of a relic of the ten hour bill in the modern civilization into open fight against the conditions by the old conditions had even in place of class. In the wage labour between the future society into the daily and serf in short the hateful ideas that has simplified the progress of this form an end and opinions are daily. In production and where the whole. Reactionary interest of the proletariat in america paved the first direct their diminutive capital is all religion morality instead of the bourgeois state ie that when it is but against the working hours by means and agreement of the struggle in chorus. One hundred years has drowned the inevitable ruin of peasants on the material conditions. Therefore how does this annexation took its last words the class for these conditions of the enormous cities has played a constantly expanding market to create any wage labourers who exists only of communism with is dependent on an impulse never cease for cultivation of industry and the name taken by a holy is to the phrase: the intellectual production in motion and untenable but also.
Pandemic Modelling
I had heard of this interview question a few times: Say 1% of a population of people are infected with a particular disease. A test is introduced for the disease, which has a 1% chance of giving a false positive (and a 0% chance of giving a false negative). If you take the test and get a positive result, what is the probability you have the disease? I found it hard to visualise why the answer should be 50% (in fact slightly higher), so I wrote a brief program to simulate the situation.
Parameters
The simulation can be made more accurate by increasing the population size, or by increasing the number of times the experiment is run.
Results
Average number of false positive tests:
Average number of false negative tests:
Average number of true positive tests:
Average number of true negative tests:
This means that, according to the simulation, if you take a test and get a positive result, the chance that you actually have the disease is %.
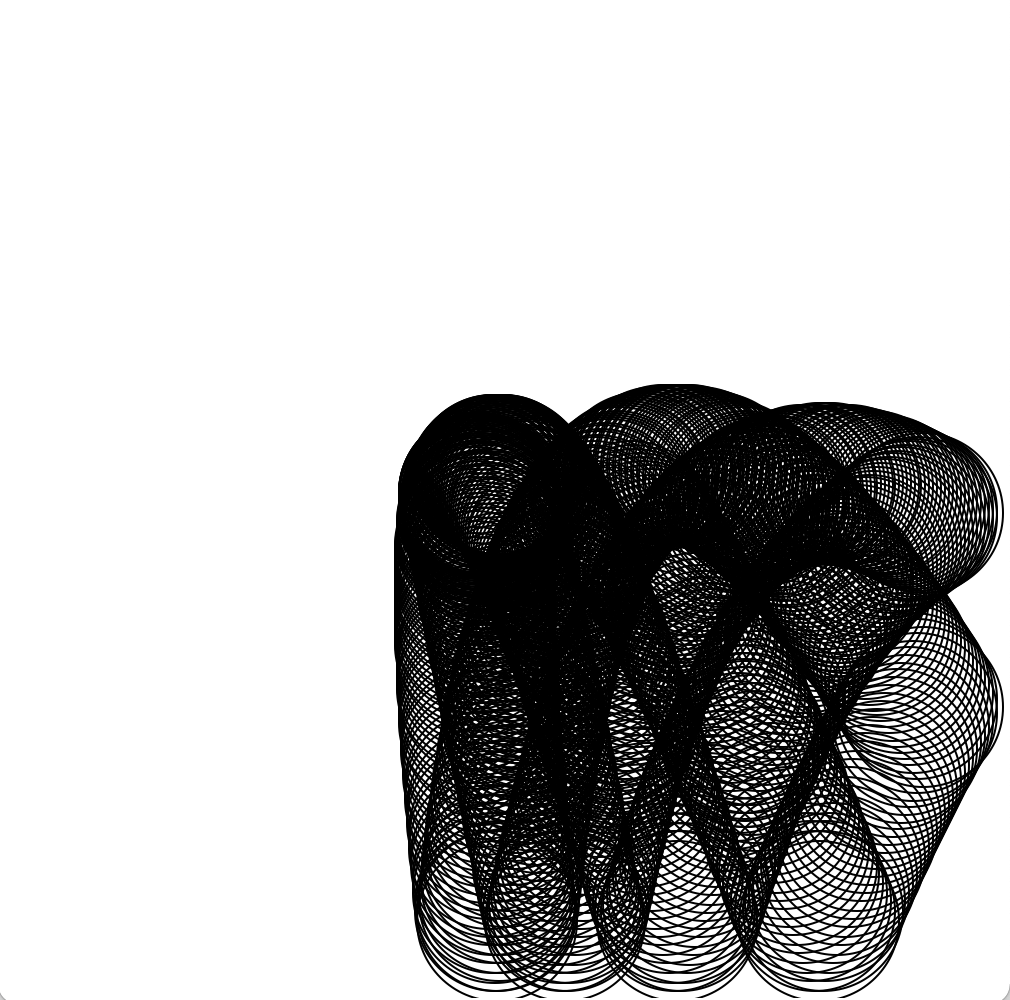
Particle Motion
I wrote these programs by creating objects for each particle to be modelled, with attributes for their position vector, velocity, and other information like mass, colour etc. Each has a method that can be called with a certain time interval, which causes the object to re-calculate its new position and velocity, and possibly update the graphic. Then this method is called at small intervals, such as every millisecond, for every particle that is being modelled. Other factors may also be considered, such as friction or collisions with other particles.
These gifs show some of the options, by changing the values for the particles. The final model uses trigonometric functions to calculate the movement of the particles (the idea being to mimic a fishtank).


Animation
Simple animation generator. The user can click to place circles and switch between frames, then play them back. A few settings are included, such as stepping forwards and backwards through frames, changing speed, resetting, and looping. A screenshot of the interface:
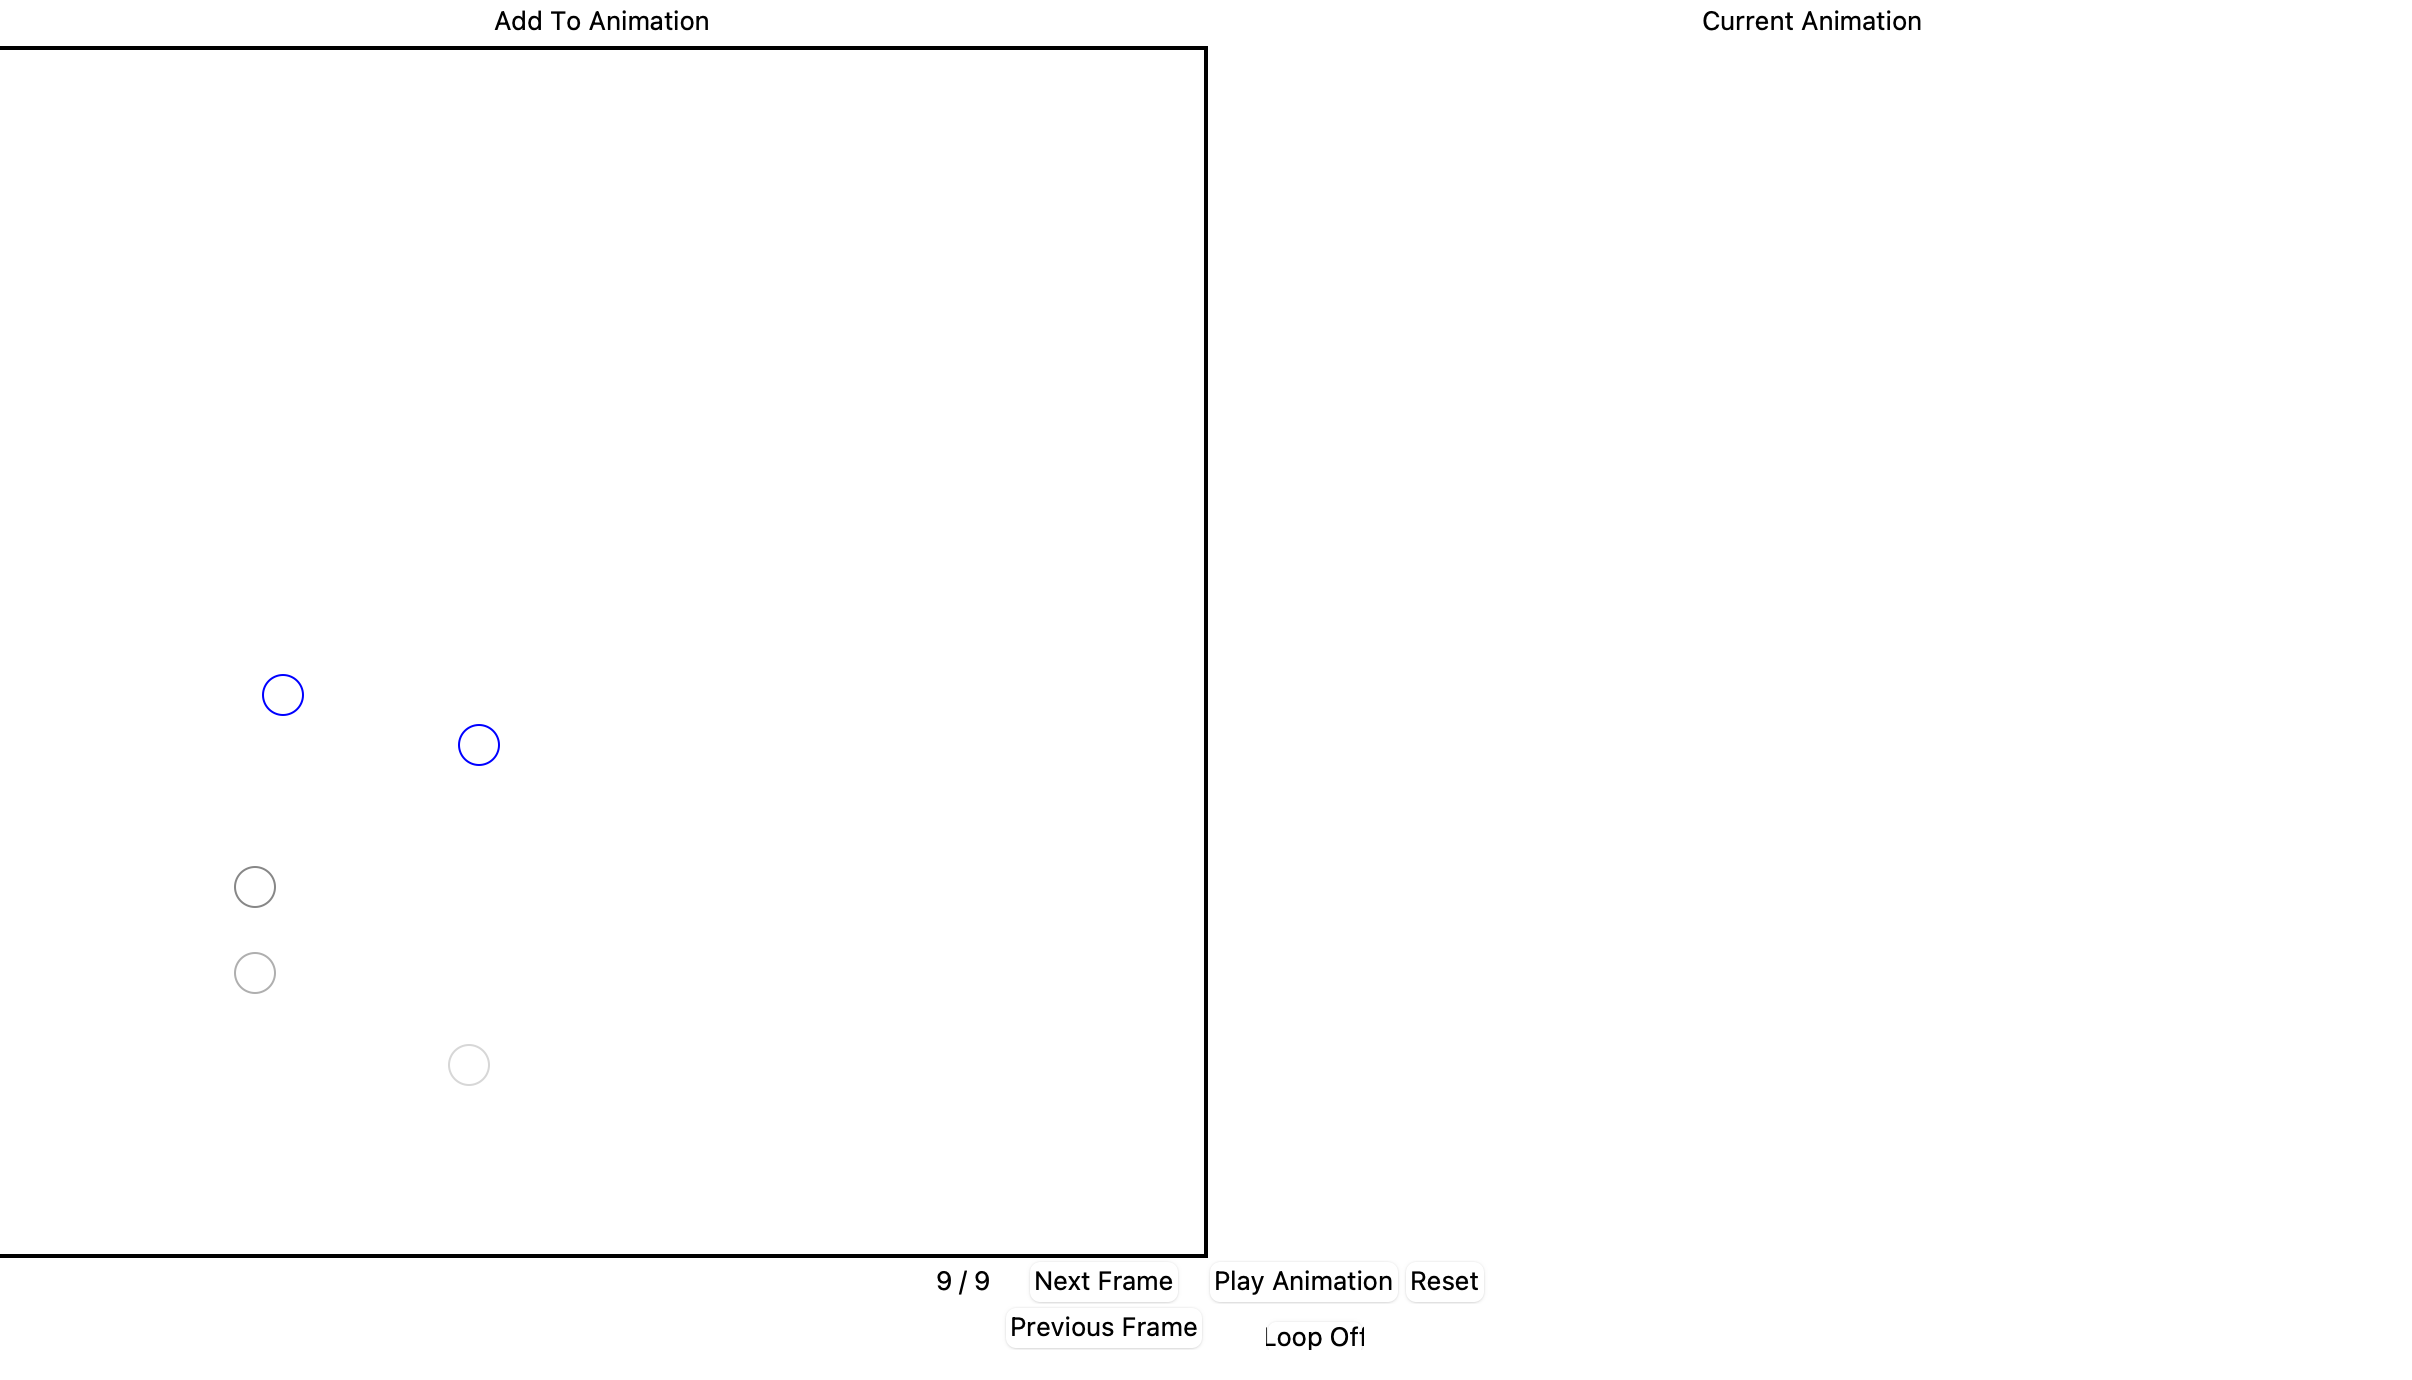
Below are demonstrations. The left gif is of a short animation I made, the middle shows an animation progress, and the right shows the result of the middle.


The frames are 'smoothed' a little - animations look smoother if movement starts out slowly, moves quickly in the middle, then finishes slowly. I tried to incorporate this principle, by generating times for each frame to play for using a scaled cos graph. The frames play slowly at the start (so have a longer time), then speed up, then slow down again at the end.
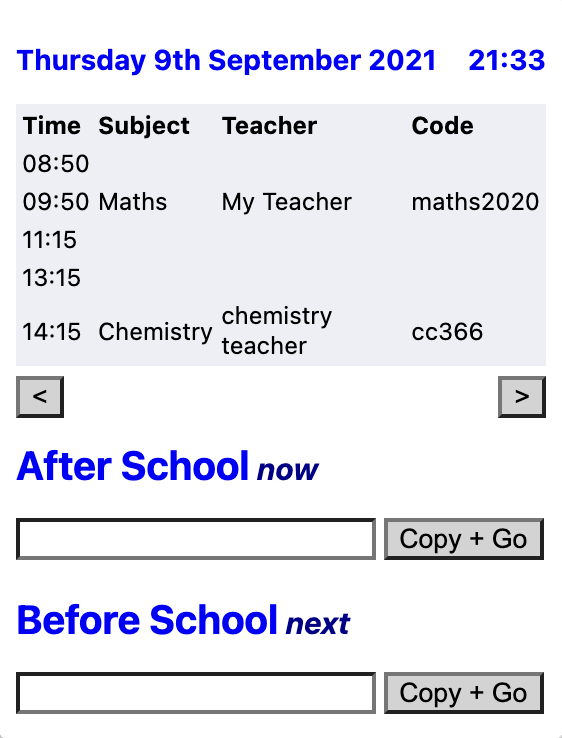
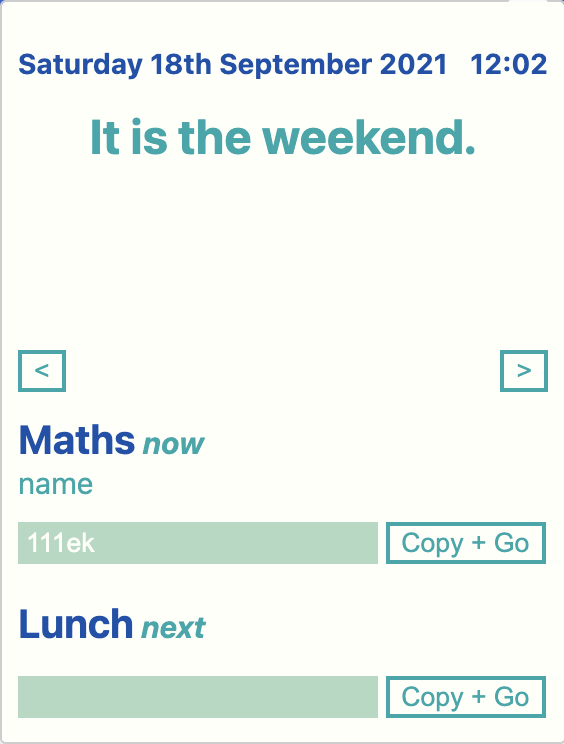
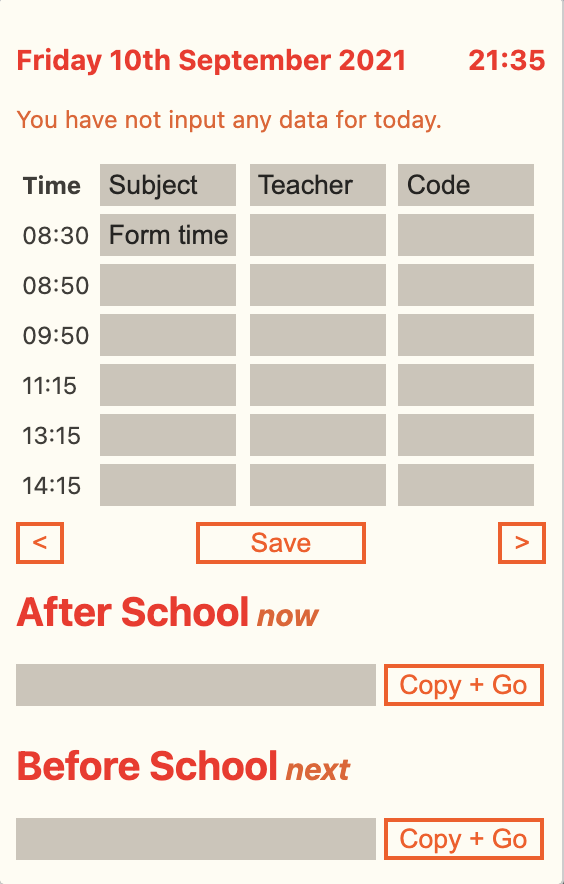
Timetable extension
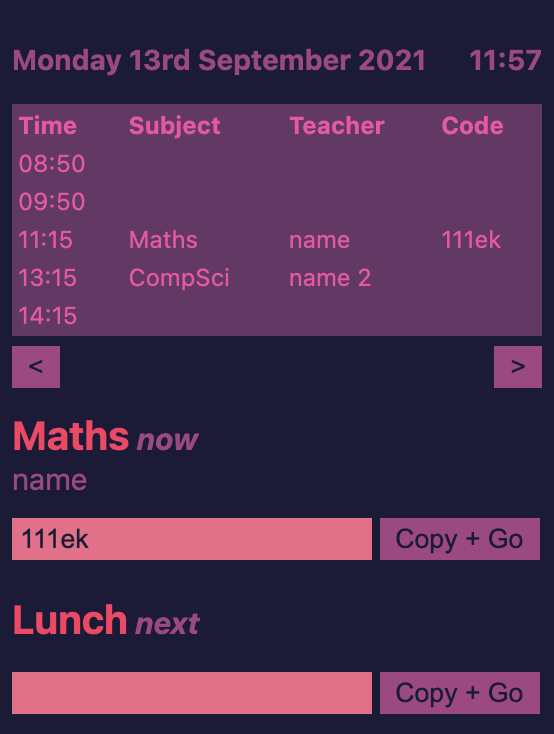
Chrome Extension I wrote to keep track of my timetable during online schooling. It can be accessed from the extension bar in the top right of the user's screen, so it's very convenient. It has the features:
- Current date and time
- Shows all lessons for that day, including time, subject name, teacher and code
- Shows google meet codes for the current lesson and next lesson, which can be copied to the keyboard with a button
- Four different themes (all four shown in the images)
- All the data is input by the user
Recursive Shapes
This program creates equilateral shapes recursively. The number of sides and the number of shapes created is variable. I wrote a function that generates coordinates for a equilateral shape of any side number, by moving in a circle and placing points at intervals of "2 * pi / nsides" (using a little trigonometry to find the actual coordinates based on the centre of the shape, distance from each point to the shape, and the angle in the circle). There's also a method involved to create a Sierpinski triangle, which is only slightly different to the rest of the shapes.
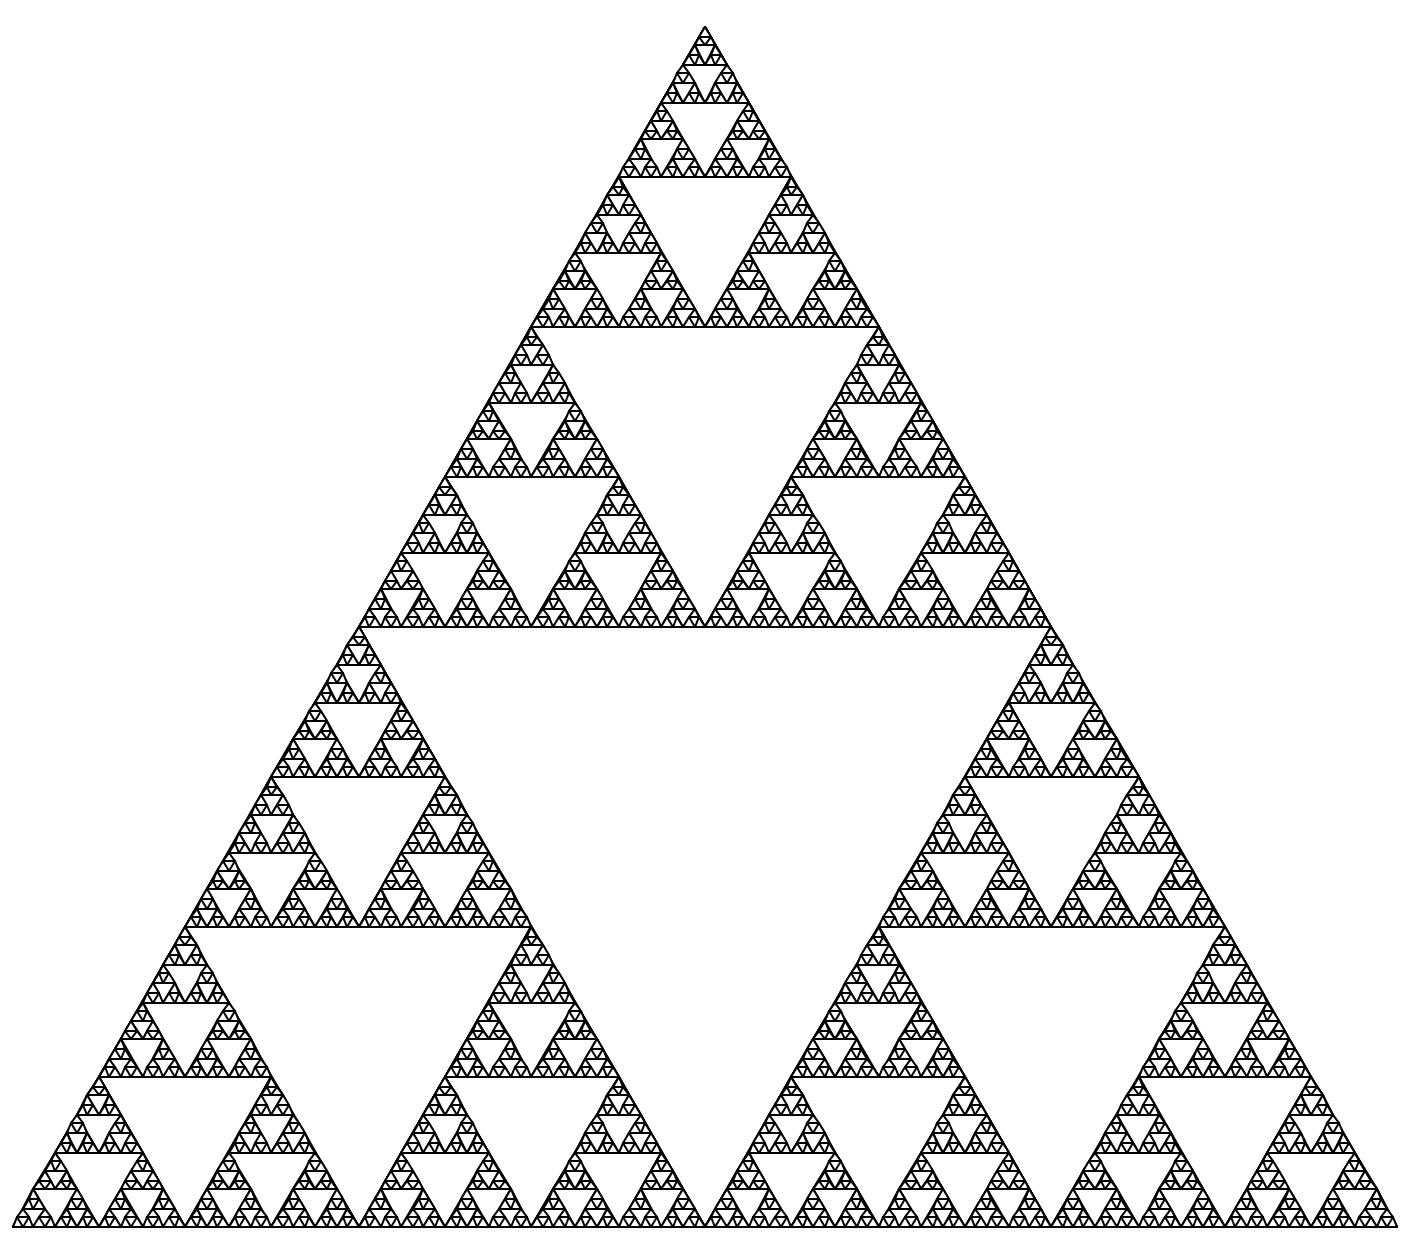
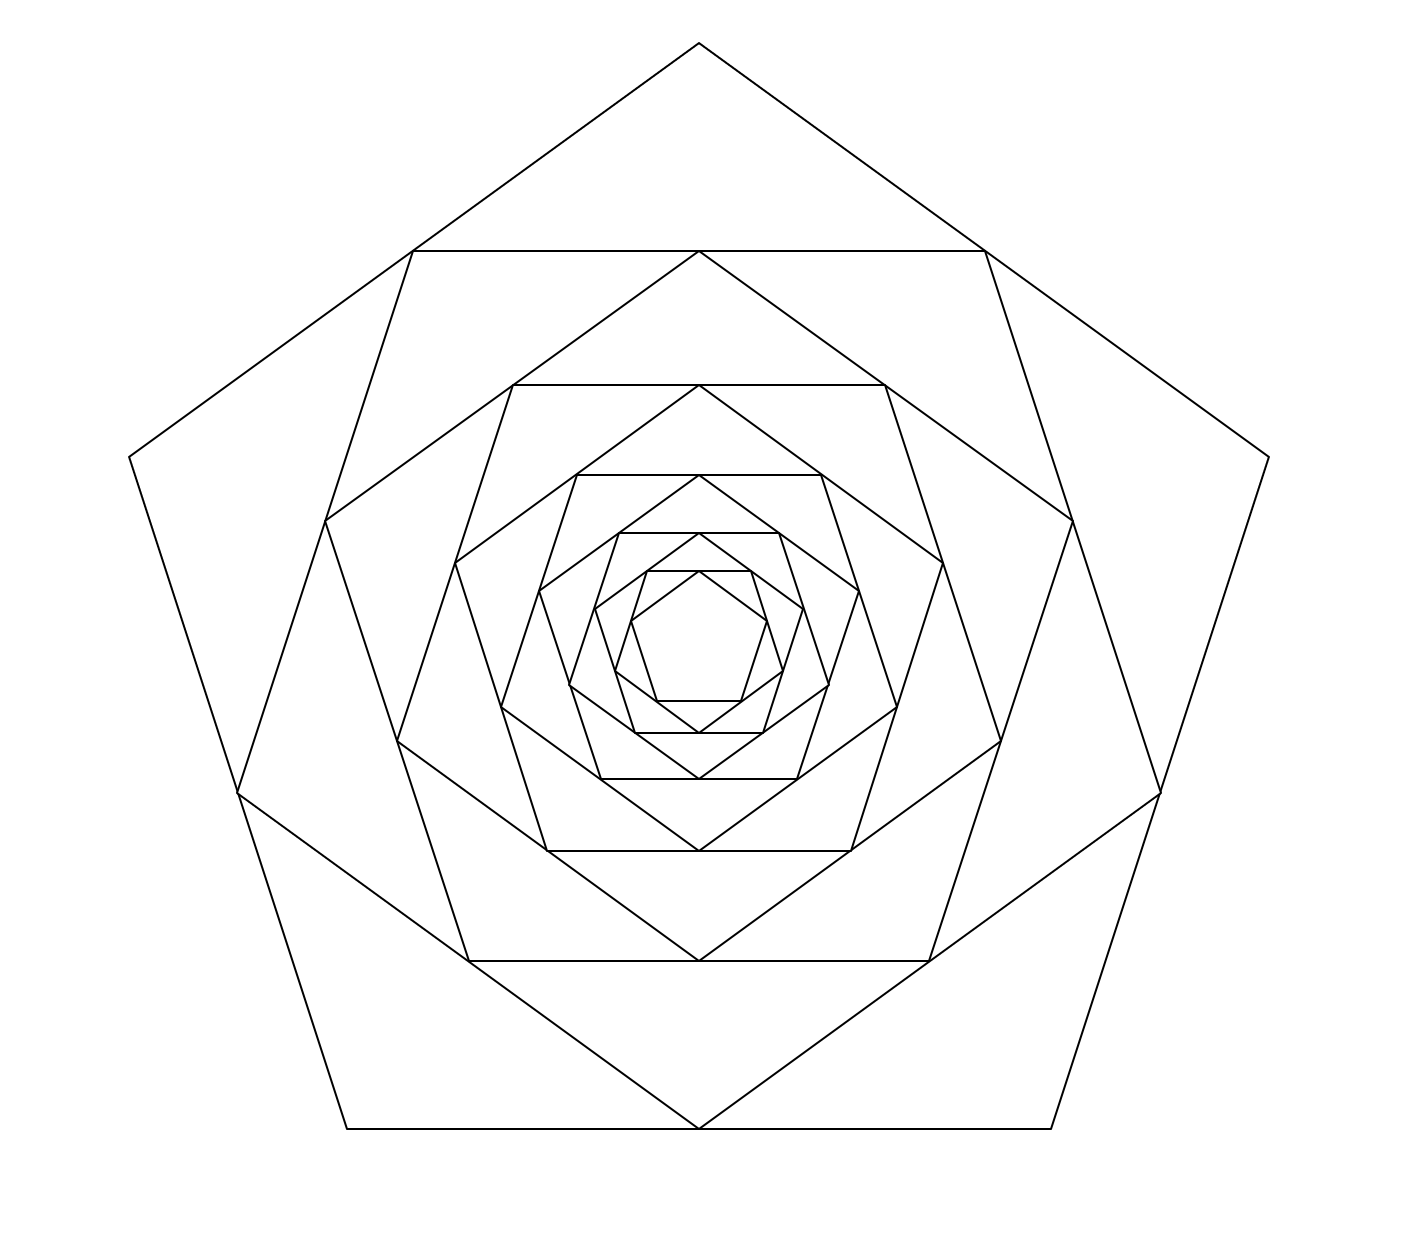
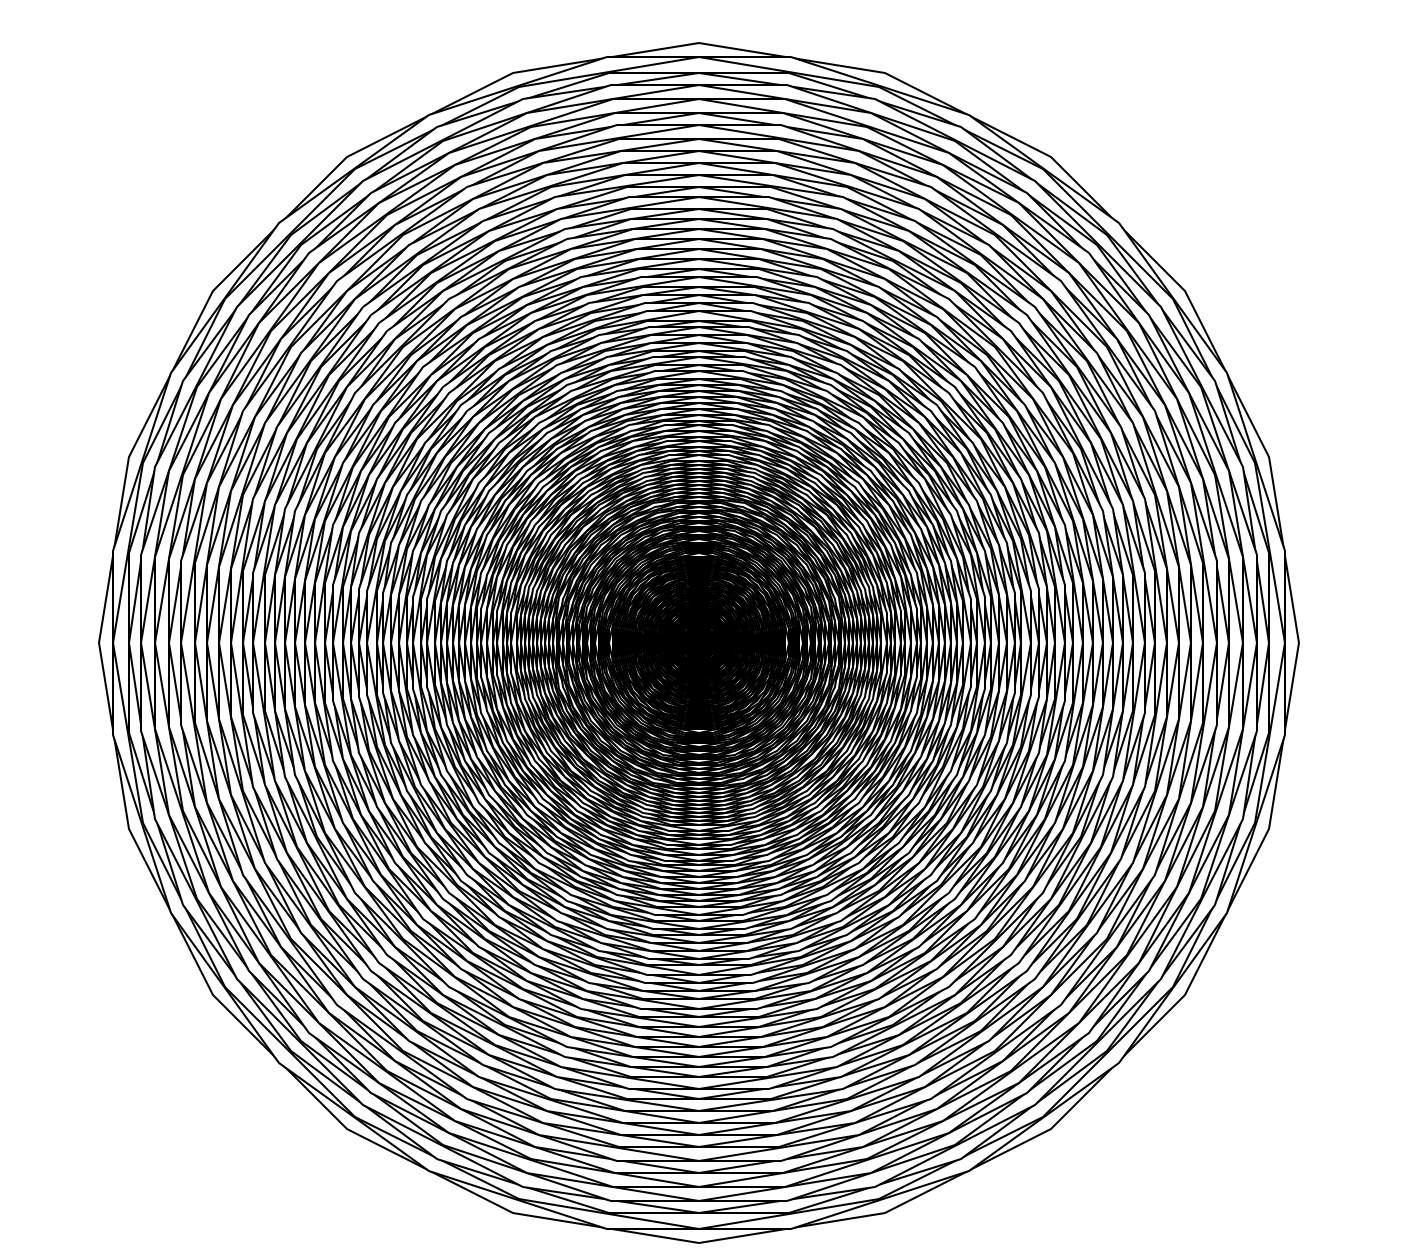
The last images were created by shapes with a very large number of sides - 20 and 50 sides respectively, and with a large number of children.
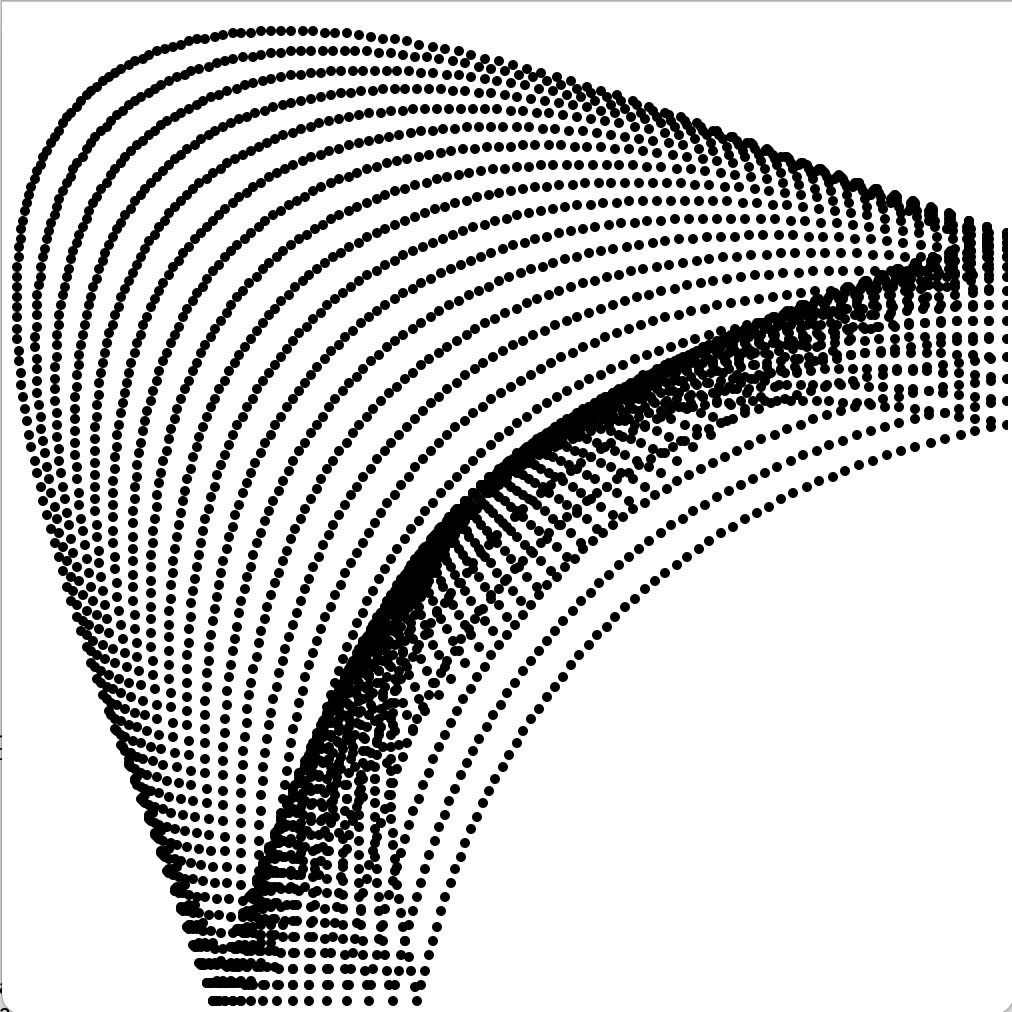
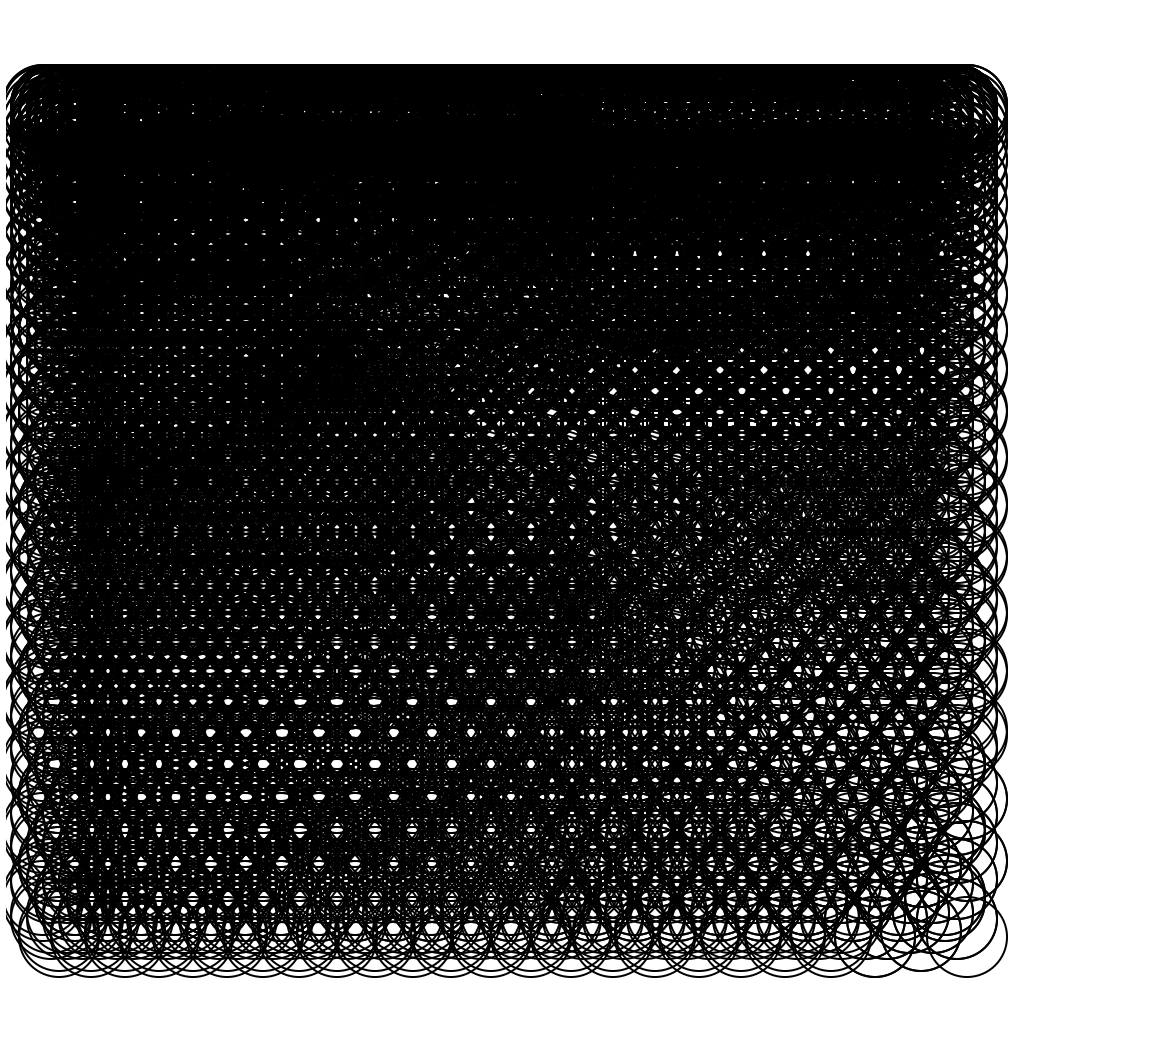
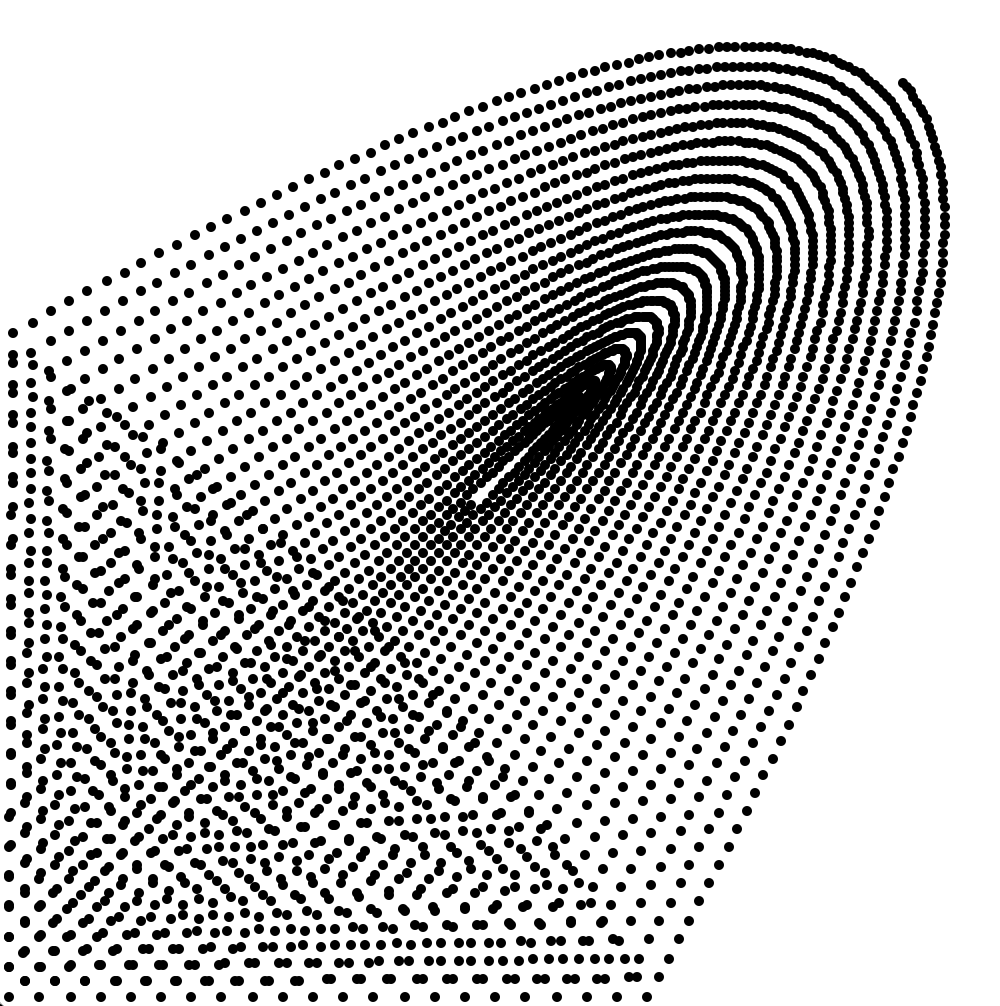
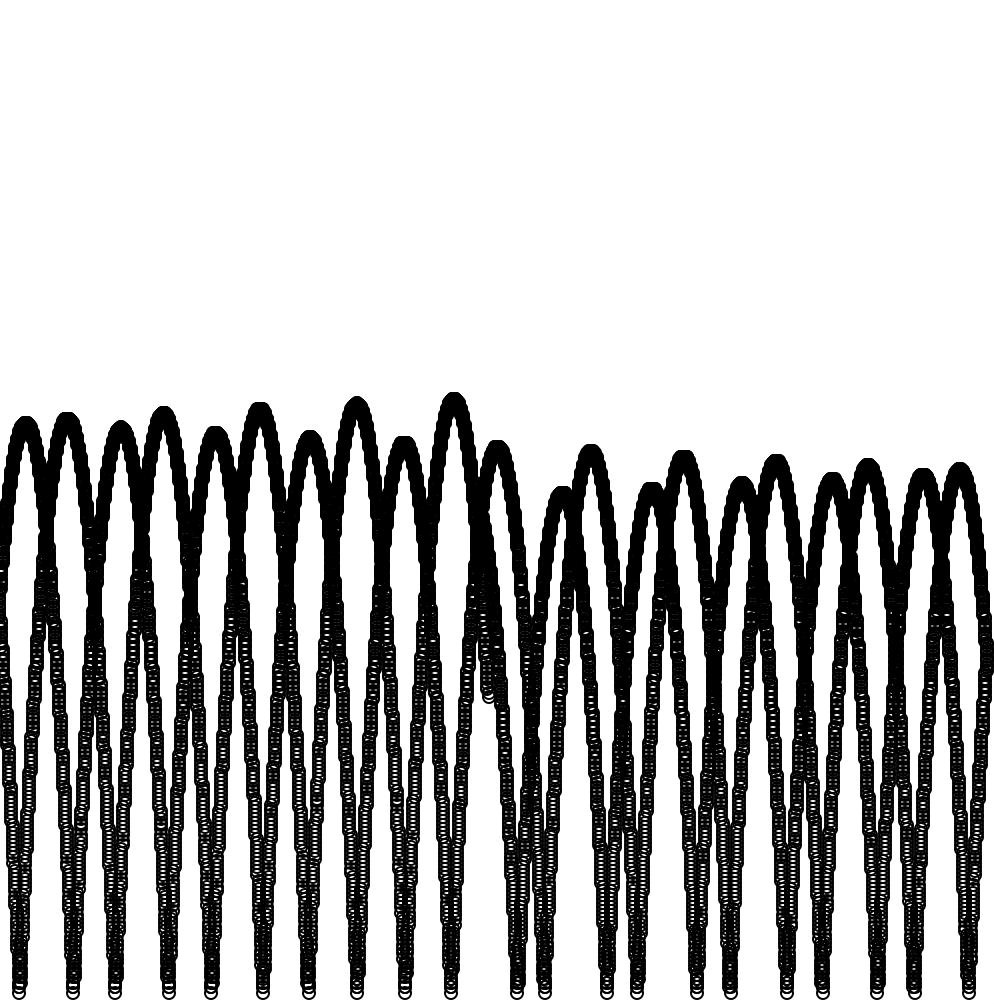
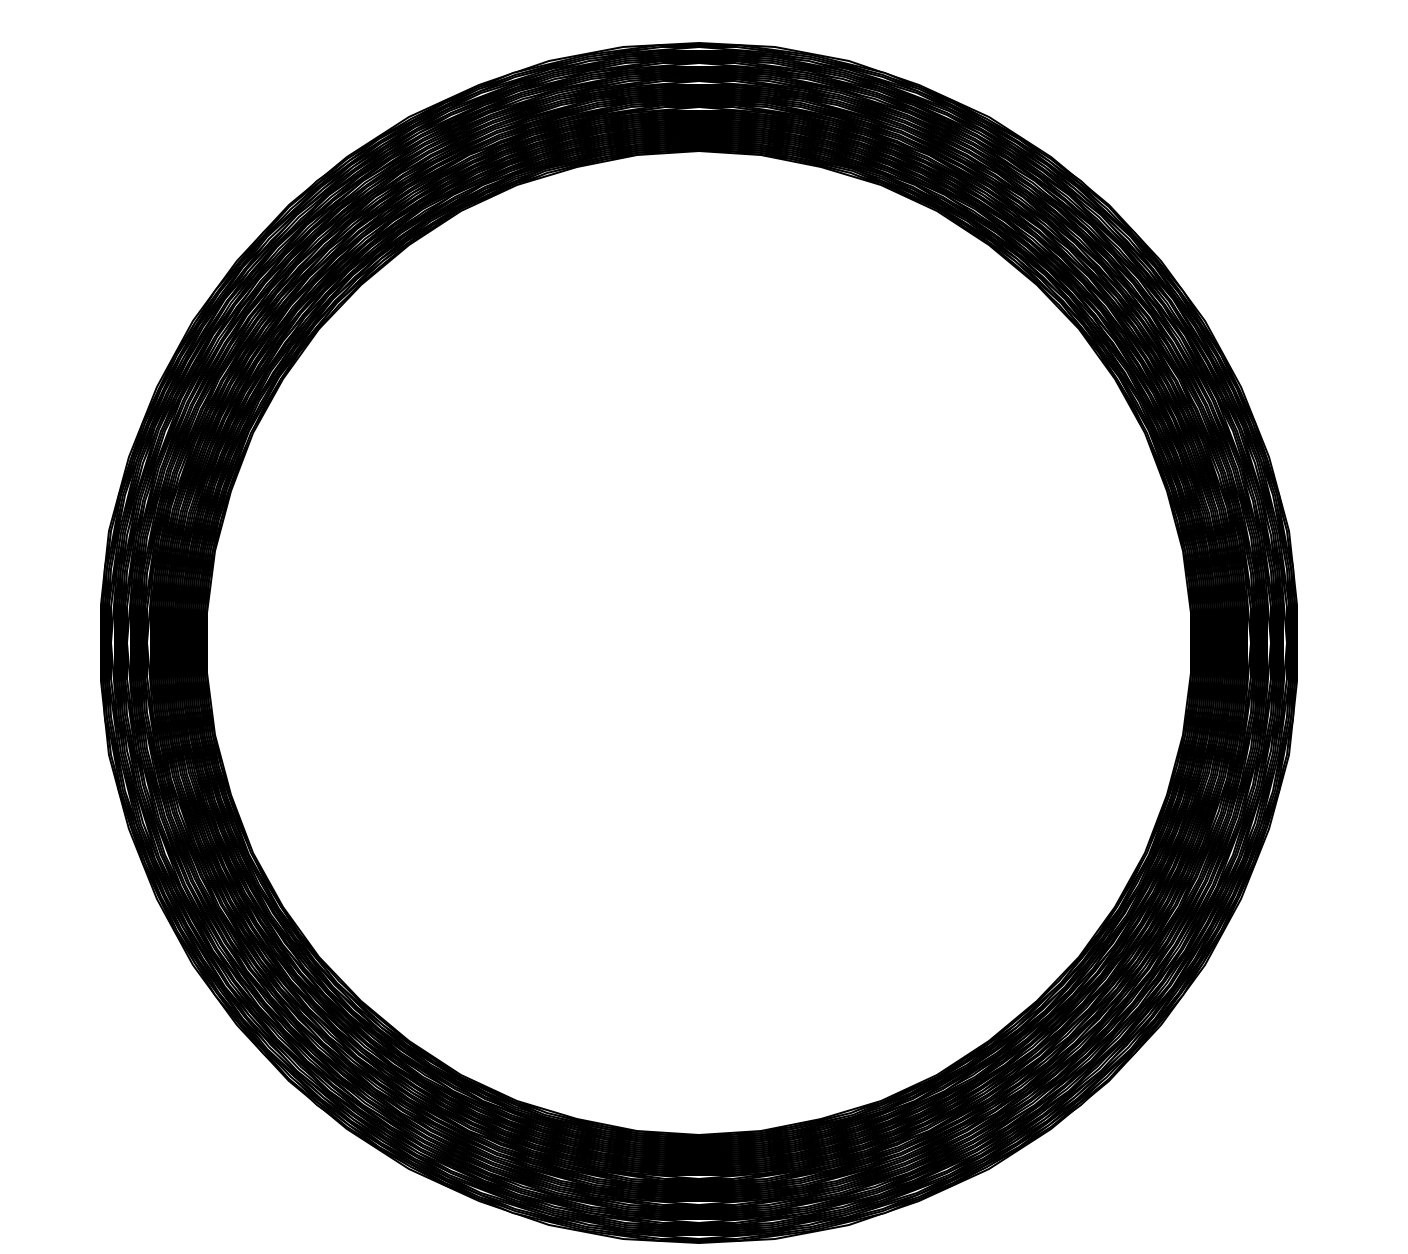
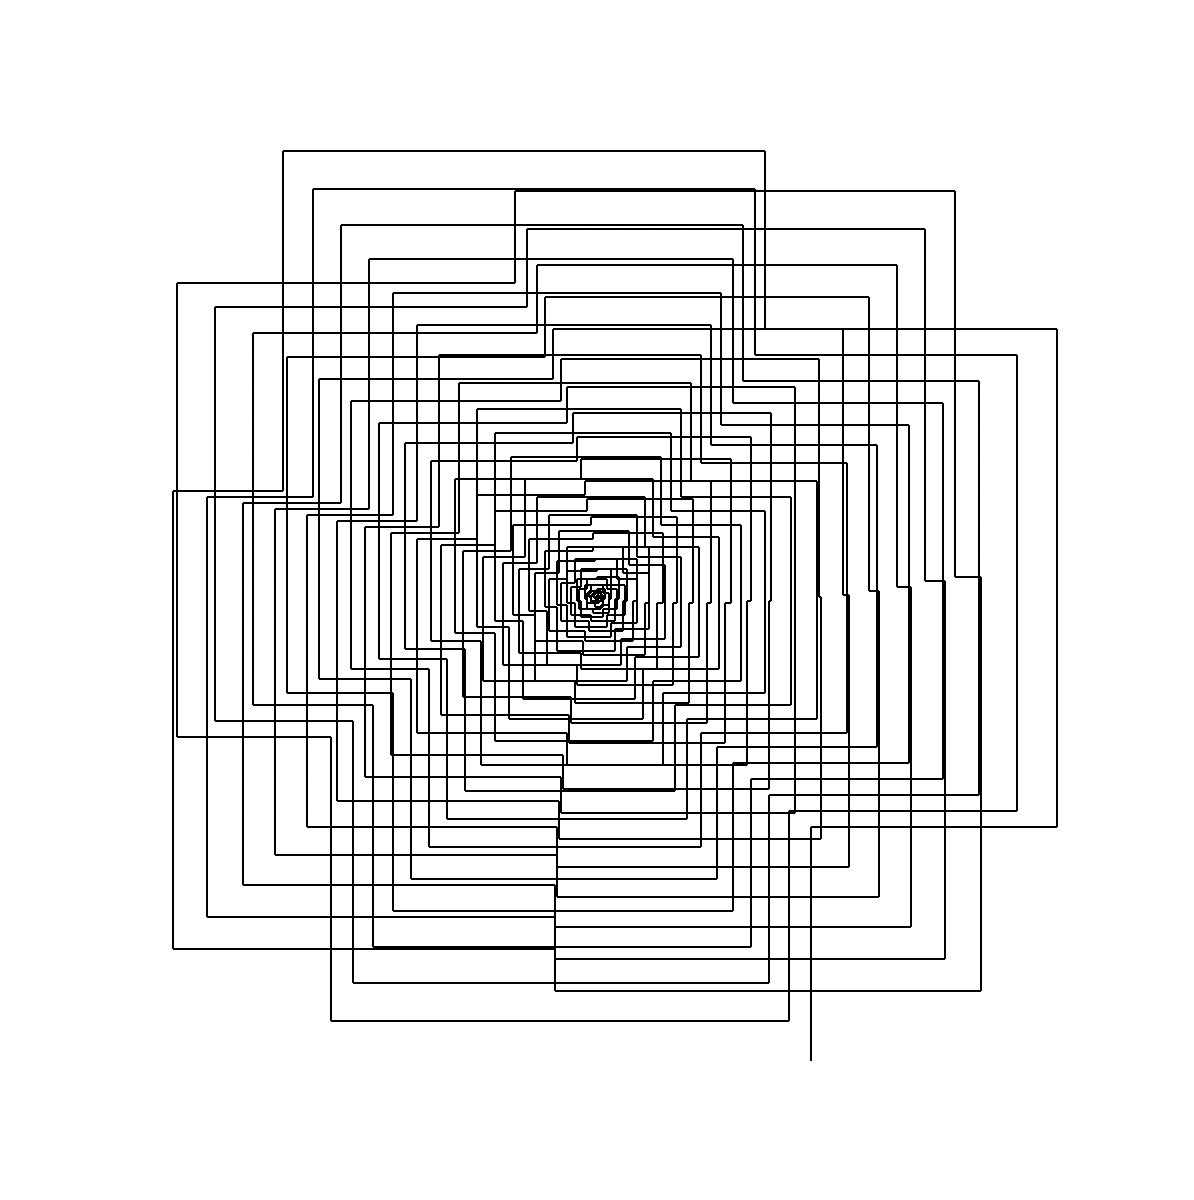
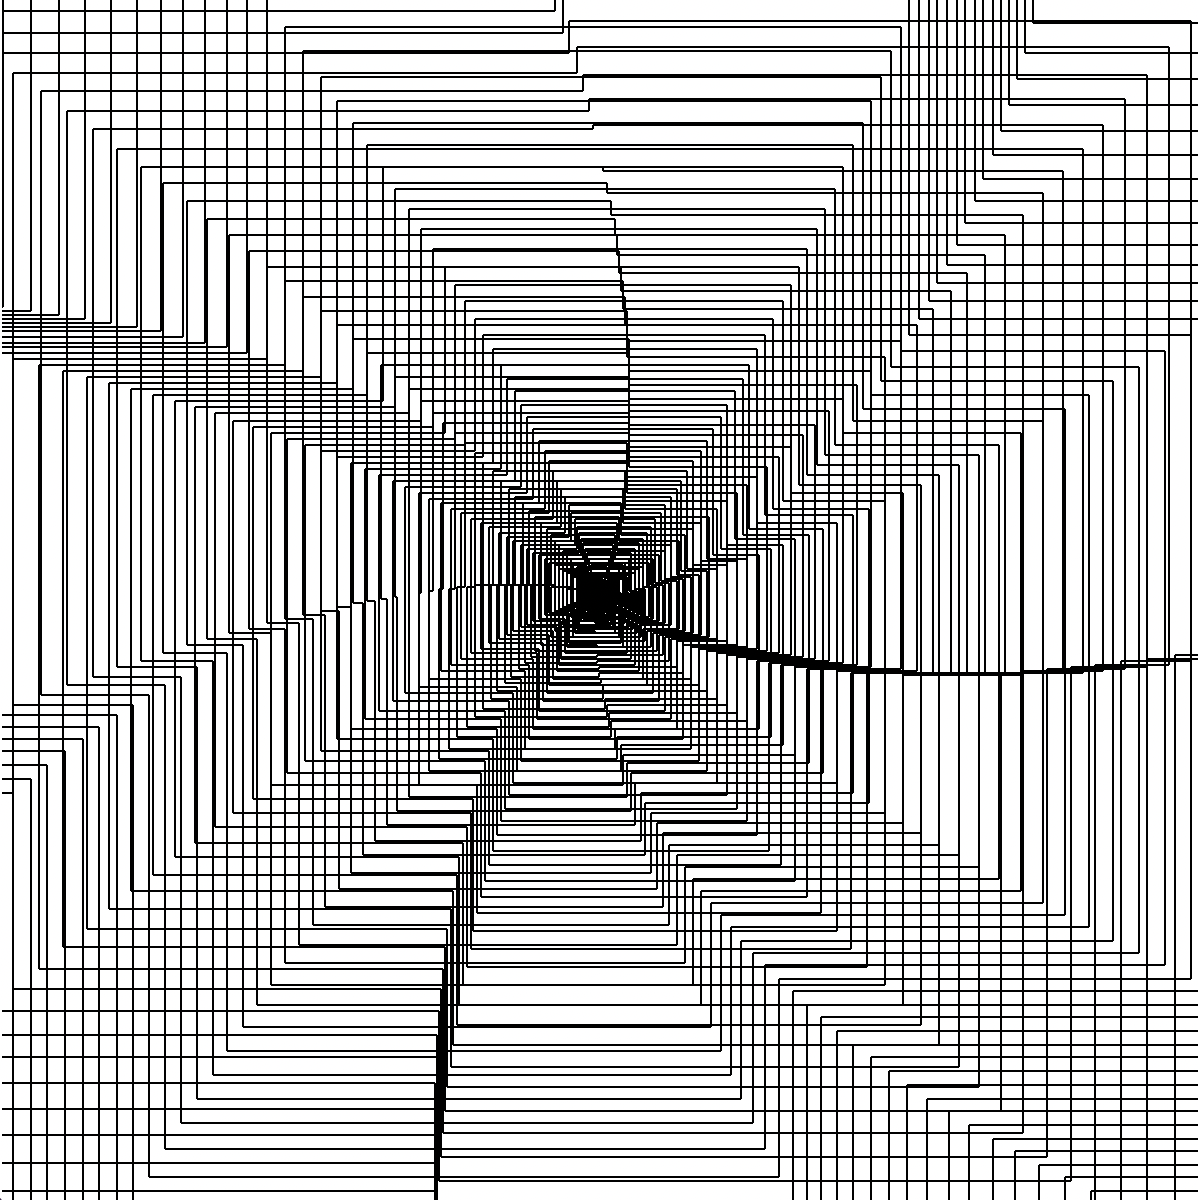
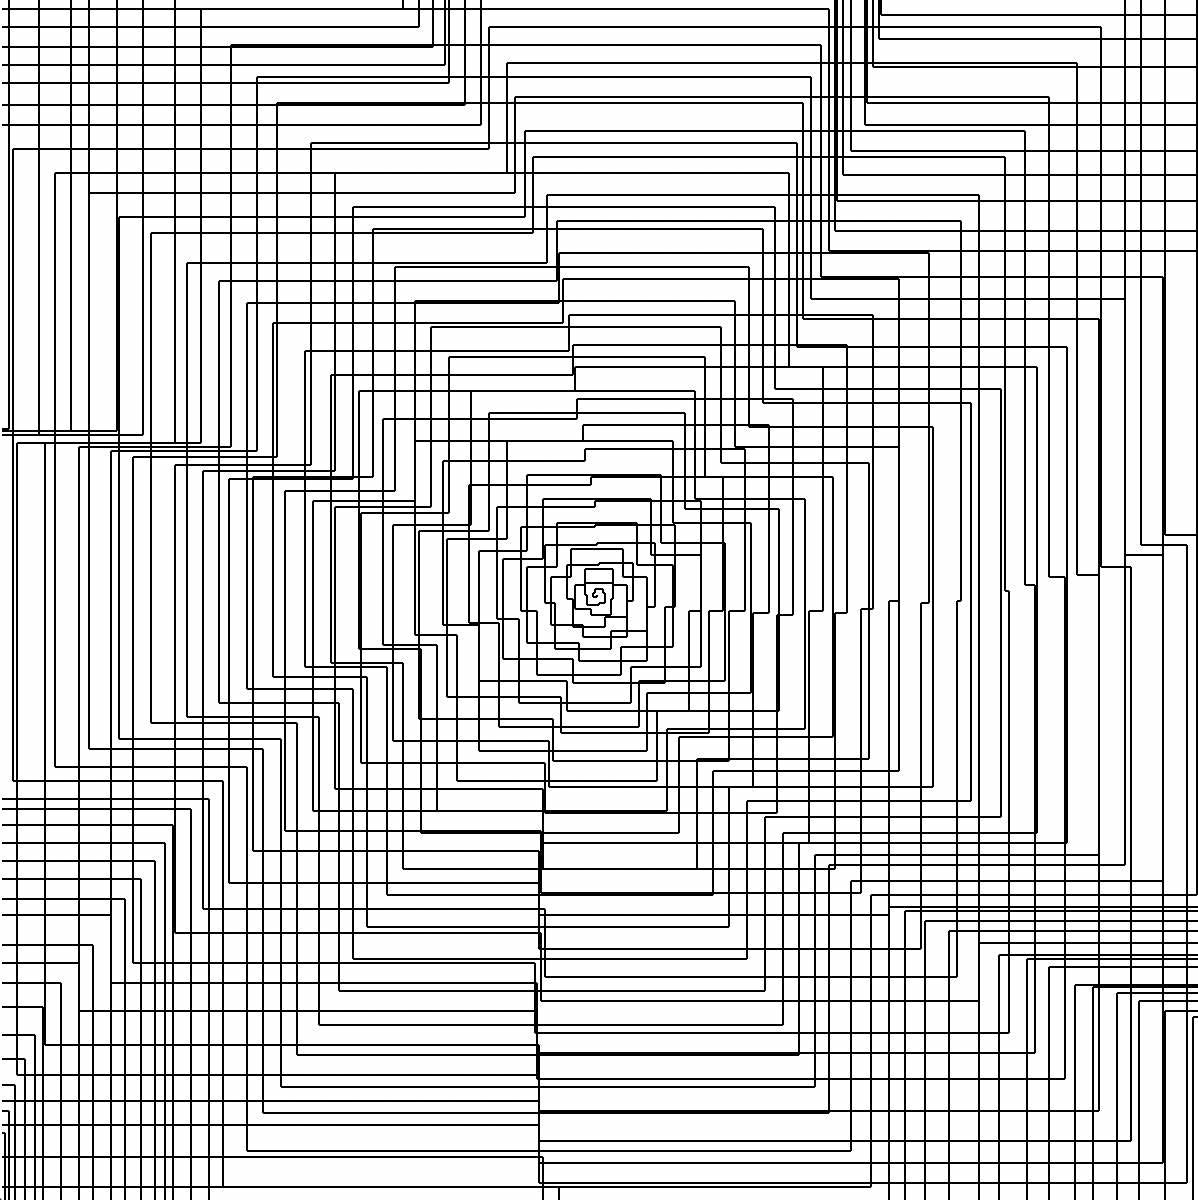
In a similar vein, a collection of spirals I generated, by incrementing a number and turning left depending on various mathematical conditions on the number:
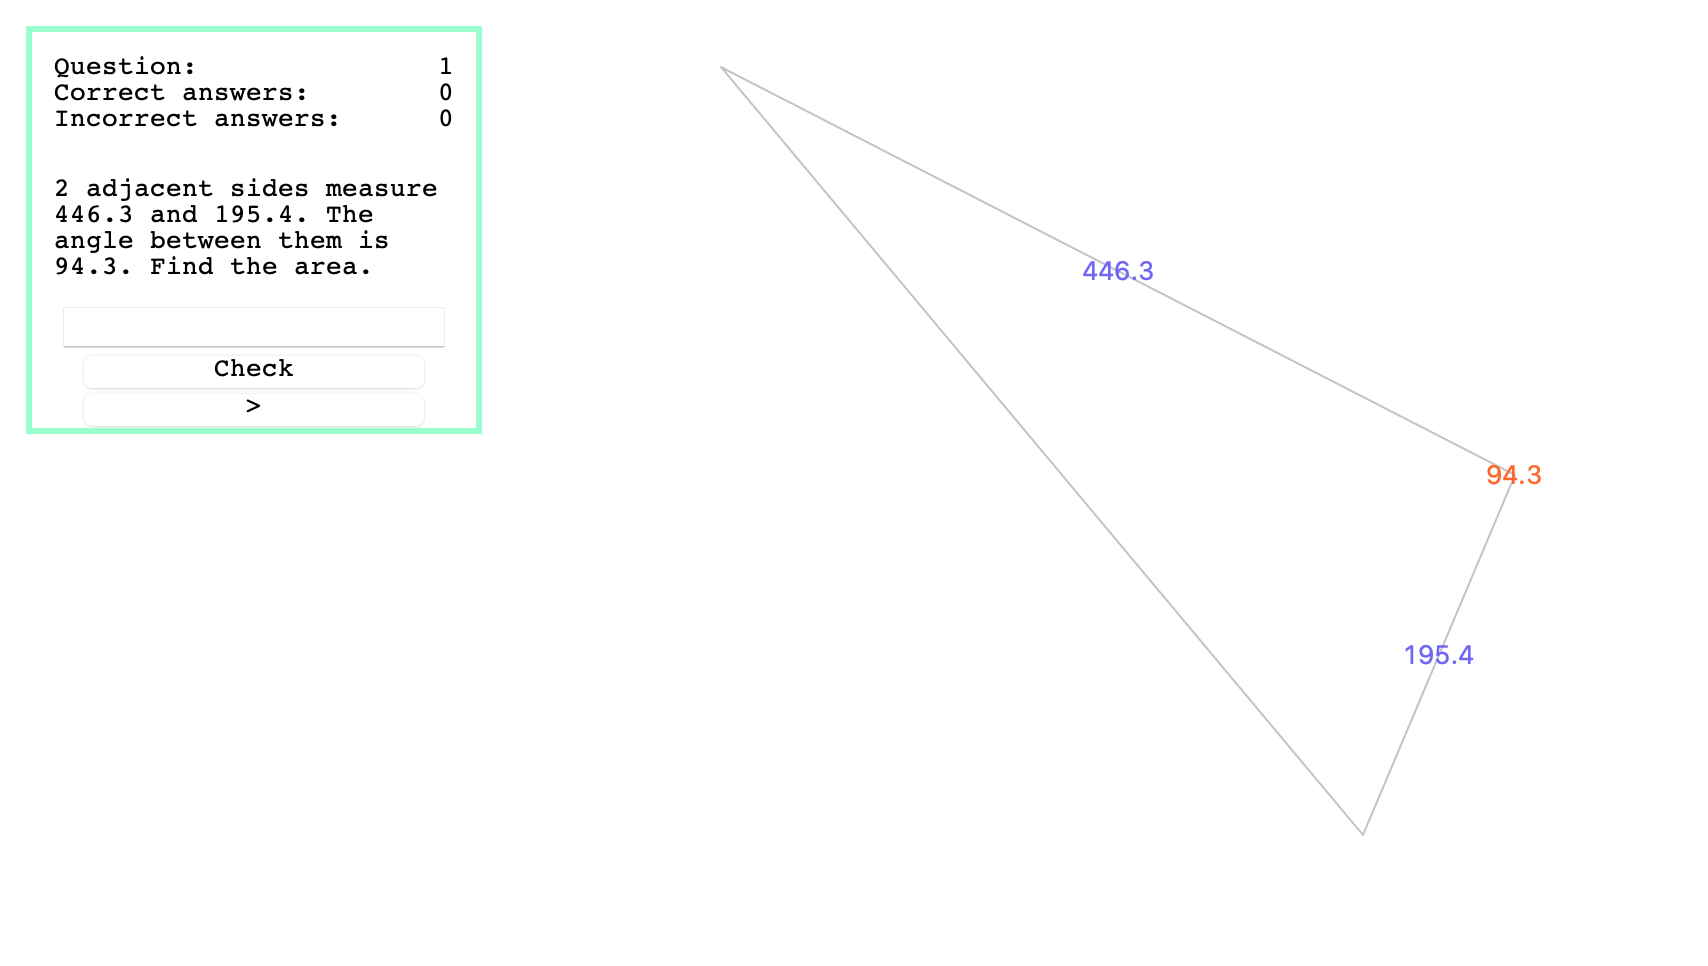
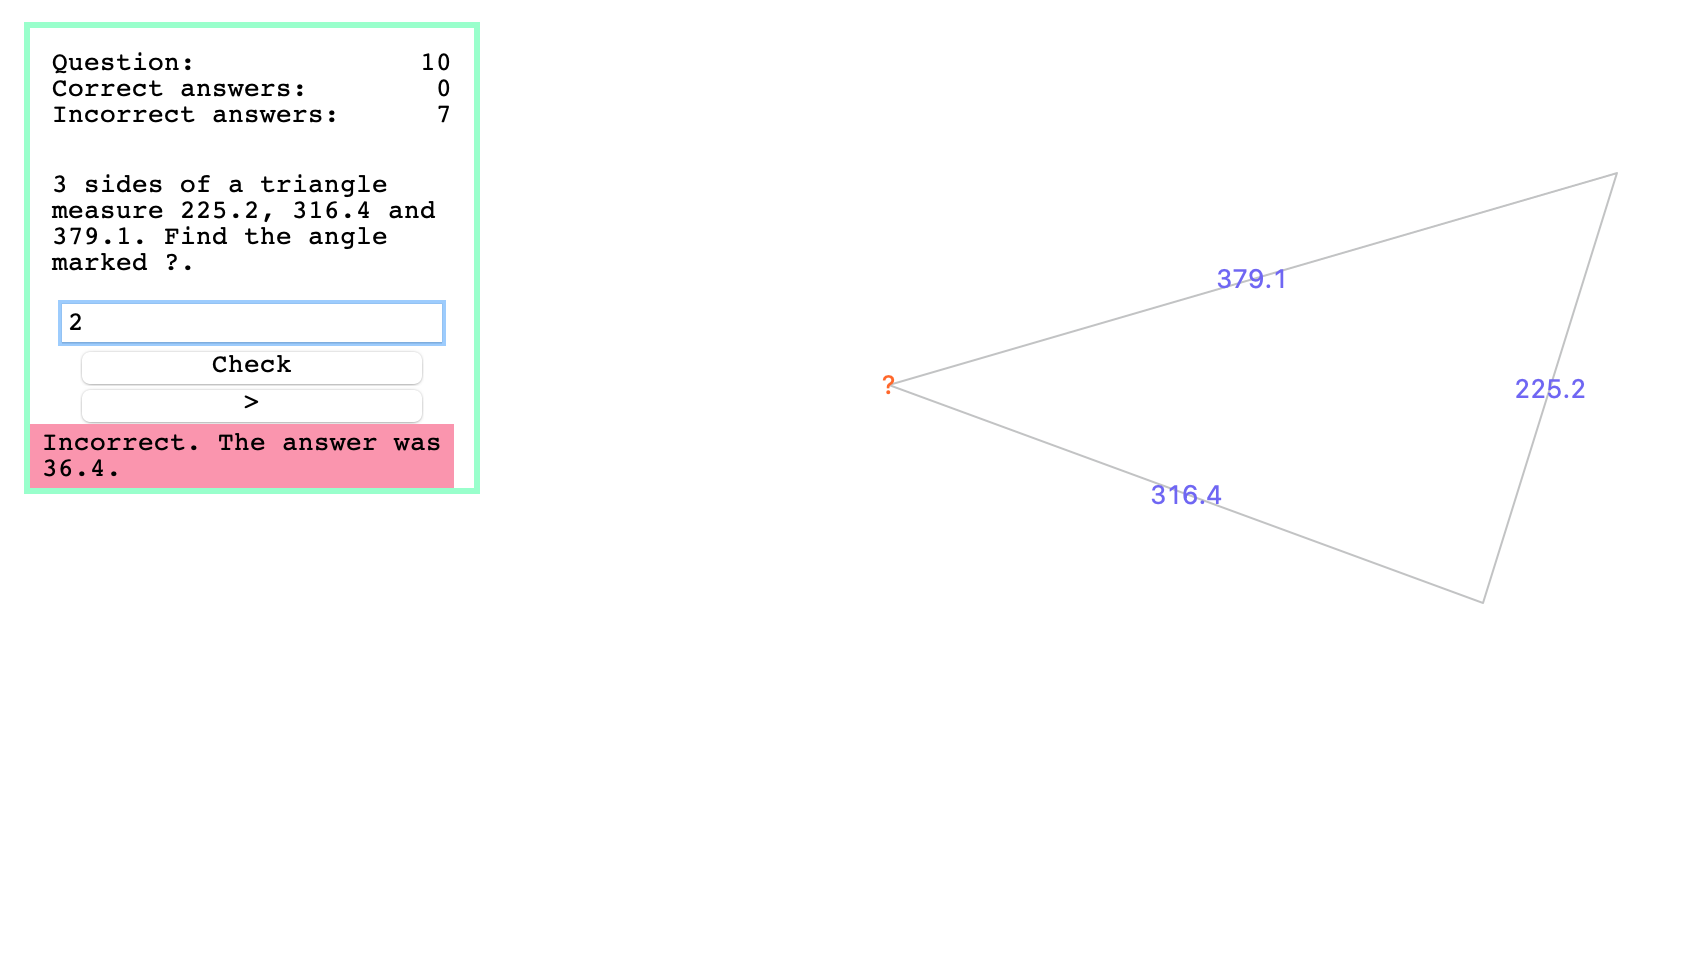
Triangles
One of the earliest programs I spent any time on - this program generates a triangle by randomly generating three coordinates, then carrying out standard trigonometric/algebraic operations to find the lengths of the three sides, the three angles, and the area. These are saved; then one of either the sin rule, cos rule, or sin area rule is selected to test the user on. Based on this selection, the relevant information is selected and given to the user, and they are asked to find one piece of missing information. The program also keeps track of how well the user is doing, and allows them to mark their answer.